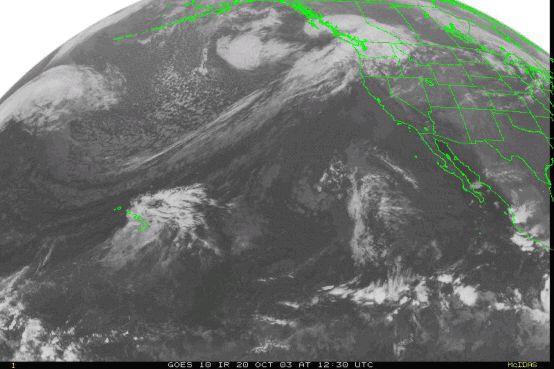
 Figure 1 Visible Satellite Image for October 20, 2003 1200Z
Washington State October 2003 Flood Report
Prepared by Rick van der Zweep, NOAA, NWRFC
A - Introduction
Heavy rains during mid-October caused severe flooding in northwest Washington, the Olympic Peninsula and on the east slopes of the Cascade Mountains. Over twenty inches of precipitation fell at several locations in northwest Washington between October 15 and 23nd (see Tables 1 and 2). Rivers in the Nooksack, Skagit, Stillaguamish, Snohomish, Skokomish, and Chehalis basins overtopped their banks and inundated adjacent land. The most severe flooding occurred along the Skagit River where more than 3400 people were evacuated. The Skagit River at the Concrete gaging station crested at a record stage 42.2 feet at 6:45am on October 21st. Flow records were also set on the Sauk River gaging station near Sauk and on the Stehekin River at Stehekin (see Table 3). State emergency declarations were issued for Clallam, Jefferson, Kitsap, Mason, Snohomish, Skagit and Watcom counties. Property damage was estimated at over 30 million dollars. Numerous federal, state and county roads were damaged. Thirty-three homes were destroyed, 112 homes had major damage and 207 homes had minor damage. To aid in the recovery of flood damaged areas in Chelan, Clallam, Grays Harbor, Island, Jefferson, King, Kitsap, Mason, Okanogan, Pierce, San Juan, Skagit, Snohomish, Thurson and Watcom counties, a federal disaster declaration was issued for those counties on November 7, 2003.
B - Precipitation
Prior to this event northwest Washington experienced the driest summer on record and September precipitation about 50% of normal. As a result, soil conditions were relatively dry when the first storm made landfall on October 15th. For this analysis, the period of precipitation was divided into two events: the first between October 15th and 18th and the second one between October 19th and 23rd. Both storms were charged with tropical moisture that was transported into the area by the jet stream. These types of event have been typically called “pineapple express” events due to the long southwesterly moisture fetch (see Figures 1 and 2). Being of tropical origin, the air contained very high concentrations of precipitable water (around 1.5 inches). The combination of high precipitable water and high speed jet stream results in very heavy precipitation on favorable slopes. Freezing levels were also very high, so precipitation during these events fell as rain at all elevations in the basins.
Figure 1 Visible Satellite Image for October 20, 2003 1200Z
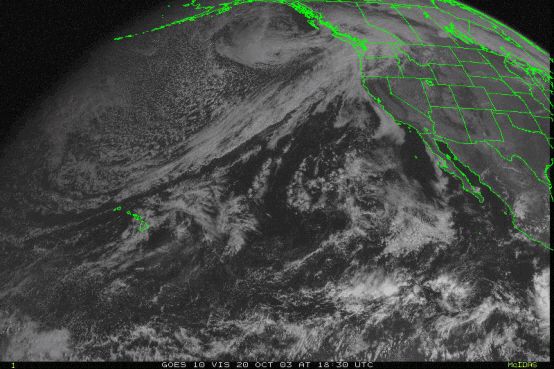 Figure 2 Visible Satellite Image for October 20, 2003 1800Z
Heaviest precipitation, during the first event fell primarily on the Olympic Peninsula and the Skagit and Nooksack basins. The second event dipped further south with the heaviest precipitation falling on Olympic Peninsula and the Skagit and Snohomish basins. Highest rainfall intensity occurred on October 20th (see Figure 3) with record one day rainfall falling at several locations, particularly in the Puget Sound area (see Table 1).
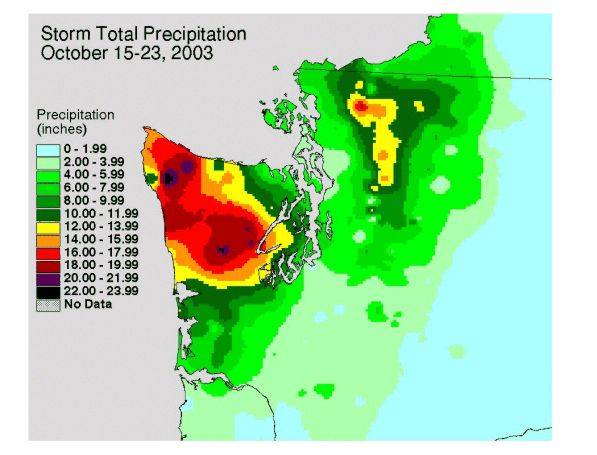 Figure 3 Cumulative Precipitation between October 15 and 23.
Table 1 Record Rainfall from October 20th
Location |
24 Hour Precipitation (in) |
Sea-Tac Airport |
5.02 |
Sand Point |
3.59 |
Shelton |
7.22 |
Landsburg |
5.50 |
Cedar Lake |
5.91 |
Wauna |
6.04 |
Cushman Powerhouse |
8.30 |
Palmer |
5.30 |
Measurements made at NRCS SNOTEL sites within the Skagit and Nooksack on October 15 showed that 6 of the 9 stations had no snow and the remain sites only a few tenths of an inch of snow water equivalent. On October 20, prior to the onset the of heaviest rainfall, the snow water equivalent only increased by a few tenths of an inch. Low snow water equivalent is typical for this time of year. On October 21 after the heaviest precipitation snow water equivalent was relatively unchanged, indicating that snow melt or rain on snow did not contribute toward the magnitude of the flood event.
|
|
|
Event 1 |
Event 2 |
Both Events |
Site |
Site |
River |
Oct 15-18 |
Oct 19-23 |
Oct 15-23 |
NWS ID |
Name |
Basin |
Precip (in) |
Precip (in) |
Precip (in) |
UIL |
Quillayute |
Olympic Coast |
12.1 |
7.9 |
20.0 |
ABEW1 |
Aberdeen |
Chehalis |
10.4 |
9.0 |
19.4 |
FRAW1 |
Frances |
Willapa |
4.1 |
6.3 |
10.4 |
GLAW1 |
Glacier RS |
Nooksack |
8.6 |
5.3 |
13.9 |
MARW1 |
Marblemount RS |
Skagit |
5.2 |
6.7 |
11.9 |
VERW1 |
Verlot |
Stillaguamish |
6.4 |
8.2 |
14.6 |
SKYW1 |
Skykomish |
Snohomish |
3.5 |
7.7 |
11.2 |
SEA |
SeaTac Airport |
Green |
1.6 |
5.7 |
7.3 |
ENUW1 |
Mud Mtn Lake |
White |
1.1 |
3.2 |
4.3 |
WYDW1 |
Wynoochee Dam |
Chehalis |
10.5 |
12.2 |
22.7 |
DARW1 |
Darrington |
Skagit/Stillaguamish |
7.5 |
7.6 |
15.1 |
|
APSW1 |
Alpine Meadow SNOTEL |
Snohomish |
2.7 |
11.8 |
14.5 |
EKMW1 |
Elk Meadows |
Chehalis |
10.1 |
9.8 |
19.9 |
TOFW1 |
Toms Creek RAWS |
Olympic Peninsula |
15.3 |
7.9 |
23.2 |
ELSW1 |
Elbow Lake SNOTEL |
Elwha |
12.5 |
9.7 |
22.2 |
MZAW1 |
Mazama SNOTEL |
Methow |
2.0 |
4.0 |
6.0 |
RAIW1 |
Rainy Pass SNOTEL |
Skagit/Methow |
3.1 |
4.1 |
7.2 |
THBW1 |
Thunder Basin SNOTEL |
Skagit/Lake Chelan |
6.5 |
9.3 |
15.7 |
PCRW1 |
Park Creek Ridge |
Skagit/Lake Chelan |
3.7 |
4.8 |
8.5 |
C - Flooding
These events were unusual because they occurred at the beginning of the wet season. Typically, several storms are needed to sufficiently wet the soils before the watershed responds with events of this magnitude. The rapid progression from very dry conditions to record flooding occurred when prolong moderate to heavy precipitation between October 15th and 19th was followed by high intensity precipitation on October 20th (see Figure 4). The following presentation on flooding focuses primarily on rivers where the National Weather Service provides river stage forecasts. Figure 5 shows the location of the river forecast sites that were discussed within this report. Forecasts were produced for all of the displayed sites, except the Bogachile River near La Push and the Stehekin River at Stehekin. These two sites have been proposed as future river forecast points, so only observed data was presented within this report.
 Figure 4 Temporal distribution of precipitation for sites in western Washington.
 Figure 5 Location Map of National Weather Service Current and Proposed River Forecast Points
in northwest Washington.
Figure 5 Location Map of National Weather Service Current and Proposed River Forecast Points
in northwest Washington.
Flood hydrographs for several sites are presented to show the relative magnitude of the event. Plots were made from preliminary data that is subject to change. Horizontal line segments on the hydrograph were periods of missing data and should be disregarded. Table 3 contains a listing of event characteristics for each forecast point that experienced flooding.
Precipitation was heavier in the northern most portion of western Washington during the first event precipitation, causing the first peak in the Nooksack Basin to be greater than the second one (see Figure 6). Flow on the Nooksack at Deming reach the major flood stage during the first event, but was several feet shy of that mark during the second event. The return period of the October 17th event on the Nooksack was around 10 years. For all of the other basins in western Washington, the peak discharge rate of the second event exceeded that of the first one. The Stillaguamish River at Arlington reached a record stage on October 21st. This site did not have telemetry equipment but the hydrograph was assumed to be similar to the one recorded at the gaging station located on the North Fork Stillaguamish River near Arlington (see Figure 7).
 Figure 6 Flood Hydrograph for the Nooksack River at Deming.
 Figure 7 Hydrograph for the North Fork Stillaguamish River near Arlington.
In the Skagit River Basin, record floods were recorded at several sites during the October 21st event. Ross Reservoir inflow peaked at 53,000 cfs, which was the largest inflow recorded since the dam was constructed in 1956 (see Figure 8). The Sauk River near Sauk (flood hydrograph not displayed) also recorded the largest flow in it 73 year record and it was computed to have a 100 year return period. At Concrete, the Skagit River peaked at 42.2 feet or 14.2 feet above flood stage (see Figure 13), which was the largest event in its 77 year record.
 Figure 8 Inflow Hydrograph for Ross Reservoir.
 Figure 9 Flood Hydrograph for the Skagit River near Mount Vernon.
None of the rivers in the Snohomish Basin reached flood stage during the first event, but the heavy rainfall on October 21st rapidly push many of the NWS river forecast sites above flood stage. Figure 10 shows the rapid rise of the Snohomish River near Monroe, which was one of the downstream forecast points. The 25 year return period computed for the Skykomish River near Goldbar had the largest response in the Snohomish Basin. The Skokomish River responded
 Figure 10 Flood Hydrograph for the Snohomish River near Monroe.
similarly, peaking at 17.6 feet which was about a tenth of a foot below the record stage (see
Figure 11). Although the stage for this site was near the record, the return period was computed as a 10 year event. Aggradation along this reach of the river has increased the stage readings for a given flow. Other basins across the Olympic Peninsula also had similar return periods.
The Stehekin Basin, located on the east slope of the Cascade Mountains adjacent to the west draining Skagit Basin, also received very heavy rainfall during the second event. The event of October 21st was the largest peak on record and had a return period of 100 years. The Stehekin River was not a NWS river forecast point, so no flood stage had been established for this location.
 Figure 11 Flood Hydrograph for the Skokomish River near Potlatch.
 Figure 12 Flood Hydrograph for the Stehekin River at Stehekin.
Effects of Reservoir Storage and Routing on the Lower Skagit
Dry conditions prior to the event caused reservoirs levels to be lower than normal. Although the reservoirs in the Skagit Basin have limited flood storage capacity, the additional capacity increased the ability to reduce downstream discharge. A comparison of regulated stream flow measured at Concrete with simulated unregulated flow shows the degree that river stage was affected by reservoir regulation of runoff (see Figure 13). The simulation indicates that the Skagit River at Concrete would have peak around 46.0 feet if there were no dams within the basin. The highest observed stage at Concrete was 42.2 feet.
 Figure 13 Comparison of Regulate and Unregulated Flow in the Skagit River near Concrete.
Unregulated flow at Concrete was back calculated after the event by inputting observed reservoir inflow data and observed discharge from unregulated tributaries into the NWSRFS model. Model simulations were run on a six hour time step which causes some smoothing of the hydrograph, so the actual unregulated flow at Concrete likely could have been slightly higher than 46.0 feet.
Routing of flood flows through the 38 mile reach from Concrete to Mount Vernon dramatically attenuated the peak. The peak discharge decreased from 164,000 cfs to 129,000 between those two points. The 21% decrease in discharge appears to primarily result from temporary runoff storage in the channel and on the flood plain (see Figure 14). The figure depicts the change in runoff volume between Concrete and Mount Vernon. Values below zero indicate runoff going into storage and positive numbers show runoff coming out of storage. Runoff went into storage during the rising limb of the hydrograph at a faster rate than it exited from storage after the flow
 Figure 14 Temporary storage of runoff between Concrete and Mount Vernon.
peaked. The flood event on October 21st also had relatively low volume, so a larger percentage of the peak discharge was lost to storage. Another factor to consider was the total event runoff volume passing Mount Vernon was only 1.7% greater than the volume measured at Concrete, though the drainage area increased by about 10%. It was not known if the low increase in volume was due to high transmission losses within the reach or to limited local area flow contributions.
Table 3 SUMMARY OF OCTOBER 2003 FLOOD EVENTS IN NORTHERN WASHINGTON |
|
Revised: 19 Nov 2003 |
|
|||||||||||||
|
|
|
|
|
|
|
|
|
|
|
|
|
|
|
|
|
|
|
|
|
|
|
|
|
|
|
|
|
|
|
|
|
|
|
|
|
Major |
|
October 17 Event |
|
October 21 Event |
|
||||||||
Site |
Site Name |
Flood |
Flood |
|
Time When |
Time When |
Peak Discharge1 |
|
Time When |
Time When |
Peak Discharge1 |
|
||||
NWS ID |
|
Stage (ft) |
Stage (ft) |
|
FS reached |
MF reached |
Time |
Hg (ft) |
Q(cfs) |
|
FS reached |
MF reached |
Time |
Hg (ft) |
Q(cfs) |
|
|
|
|
|
|
|
|
|
|
|
|
|
|
|
|
|
|
Nooksack River Basin |
|
|
|
|
|
|
|
|
|
|
|
|
|
|
|
|
DEMW1 |
Nooksack River at Deming |
12.0 |
15.0 |
|
17Oct 0630Z |
17Oct 1315Z |
17Oct 1315Z |
15.1 |
50,798 |
|
21Oct 0205Z |
--- |
21Oct 0715Z |
13.8 |
42,066 |
|
NKSW1 |
Nooksack River at Ferndale |
19.0 |
none |
|
18Oct 0700Z |
na |
18Oct 1445Z |
20.5 |
38,541 |
|
21Oct 1815Z |
na |
22Oct 0345Z |
20.8 |
39,901 |
|
|
|
|
|
|
|
|
|
|
|
|
|
|
|
|
|
|
Skagit River Basin |
|
|
|
|
|
|
|
|
|
|
|
|
|
|
|
|
RODW1 |
Ross Reservoir Inflow |
none |
none |
|
na |
na |
18Oct 0000Z |
na |
26,105 |
|
na |
na |
21Oct 1500Z |
na |
53,0002 |
|
UBDW1 |
Upper Baker Lake Inflow |
none |
none |
|
na |
na |
17Oct 1400Z |
na |
38,311 |
|
na |
na |
21Oct 0800Z |
na |
41,556 |
|
SAKW1 |
Sauk River near Sauk |
none |
none |
|
na |
na |
17Oct 2115Z |
11.2 |
33,118 |
|
na |
na |
21Oct 0800Z |
19.0 |
106,4912 |
|
CONW1 |
Skagit River near Concrete |
28.0 |
32.5 |
|
17Oct 0945Z |
17Oct 2215Z |
18Oct 0045Z |
33.1 |
94,733 |
|
20Oct 2100Z |
20Oct 2345Z |
21Oct 1315Z |
42.212 |
165,659 |
|
MVEW1 |
Skagit River near Mt. Vernon |
28.0 |
30.0 |
|
18Oct 0445Z |
--- |
18Oct 1515Z |
29.1 |
73,538 |
|
21Oct 0900Z |
21Oct 1545Z |
22Oct 0745Z |
36.2 |
128,960 |
|
|
|
|
|
|
|
|
|
|
|
|
|
|
|
|
|
|
Snohomish River Basin |
|
|
|
|
|
|
|
|
|
|
|
|
|
|
|
|
GLBW1 |
Skykomish River near Gold Bar |
15.0 |
19.0 |
|
--- |
--- |
17Oct 1815Z |
12.0 |
22,101 |
|
20Oct 2330Z |
21Oct 0315Z |
21Oct 0600Z |
20.7 |
86,430 |
|
SQUW1 |
Snoqualmie River near Snoqualmie |
13.5 |
18.1 |
|
--- |
--- |
17Oct 0300Z |
11.0 |
9,826 |
|
21Oct 0630Z |
--- |
21Oct 1345Z |
15.8 |
29,200 |
|
TOLW1 |
Tolt River near Carnation |
8.9 |
none |
|
--- |
na |
16Oct 2200Z |
6.7 |
1,370 |
|
20Oct 2130Z |
na |
21Oct 0400Z |
11.1 |
11,000 |
|
CRNW1 |
Snoqualmie River near Carnation |
54.0 |
58.0 |
|
--- |
--- |
17Oct 0500Z |
49.7 |
9,101 |
|
21Oct 1030Z |
--- |
21Oct 0100Z |
56.8 |
30,982 |
|
MROW1 |
Snohomish River at Monroe |
14.0 |
17.0 |
|
--- |
--- |
17Oct 2300Z |
8.3 |
26,555 |
|
21Oct 1100Z |
21Oct 1630Z |
21Oct 1800Z |
17.1 |
67,941 |
|
SNAW1 |
Snohomish River at Snohomish |
25.0 |
29.0 |
|
--- |
--- |
17Oct 2300Z |
18.3 |
23,366 |
|
21Oct 1230Z |
--- |
21Oct 2300Z |
28.4 |
66,358 |
|
|
|
|
|
|
|
|
|
|
|
|
|
|
|
|
|
|
Stillaguamish River Basin |
|
|
|
|
|
|
|
|
|
|
|
|
|
|
|
|
ARLW1 |
Stillaguamish River at Arlington |
14.0 |
none |
|
17Oct 1700Z |
na |
17Oct 2230Z |
16.5 |
44,500 |
|
21Oct 0000Z |
na |
21Oct1030Z |
20.752 |
46,589 |
|
|
|
|
|
|
|
|
|
|
|
|
|
|
|
|
|
|
Bogachiel River Basin |
|
|
|
|
|
|
|
|
|
|
|
|
|
|
|
|
BOGW1 |
Bogachiel River nr La Push |
38.03 |
none |
|
17Oct |
na |
17Oct |
42.5 |
|
|
20Oct |
na |
20Oct |
38.7 |
|
|
|
|
|
|
|
|
|
|
|
|
|
|
|
|
|
|
|
Dungeness River Basin |
|
|
|
|
|
|
|
|
|
|
|
|
|
|
|
|
DRSW1 |
Dungeness River nr Sequim |
7.0 |
none |
|
--- |
na |
17Oct 1115Z |
6.24 |
3,211 |
|
21Oct 0045Z |
na |
21Oct 0903Z |
7.7 |
5,920 |
|
|
|
|
|
|
|
|
|
|
|
|
|
|
|
|
|
|
Olympic Peninsula |
|
|
|
|
|
|
|
|
|
|
|
|
|
|
|
|
SRPW1 |
Skokomish River near Potlatch |
16.0 |
17.0 |
|
16Oct 2100Z |
--- |
17Oct 1445Z |
16.9 |
20,026 |
|
20Oct 1615Z |
20Oct 2315Z |
21Oct 0430Z |
17.6 |
38,353 |
|
ELWW1 |
Elwha River at McDonald |
20.0 |
23.0 |
|
17Oct 0000Z |
17Oct 0200Z |
17Oct 0700Z |
23.9 |
29,128 |
|
20Oct 1930Z |
21Oct 0230Z |
21Oct 0430Z |
23.9 |
23,093 |
|
|
|
|
|
|
|
|
|
|
|
|
|
|
|
|
|
|
Chehalis River Basin |
|
|
|
|
|
|
|
|
|
|
|
|
|
|
|
|
SATW1 |
Satsop River at Satsop |
34.0 |
38.0 |
|
--- |
--- |
18Oct 0300Z |
32.5 |
16,165 |
|
21Oct 0000Z |
--- |
21Oct 1200Z |
36.5 |
35,852 |
|
|
|
|
|
|
|
|
|
|
|
|
|
|
|
|
|
|
Lake Chelan Basin |
|
|
|
|
|
|
|
|
|
|
|
|
|
|
|
|
STHW1 |
Stehekin River at Stehekin |
none |
none |
|
na |
na |
17Oct 2200Z |
23.8 |
6,716 |
|
na |
na |
21Oct 0530Z |
31.1 |
25,9002 |
|
|
|
|
|
|
|
|
|
|
|
|
|
|
|
|
|
|
1 - Based upon preliminary data |
|
|
|
|
|
|
|
|
|
|
|
|
|
|
|
|
2 - Record flow |
|
|
|
|
|
|
|
|
|
|
|
|
|
|
|
|
3 - Proposed flood stage |
|
|
|
|
|
|
|
|
|
|
|
|
|
|
|
|
D - Flood Photographs
Forecast Verification
Precipitation Forecasts
The Hydrologic Prediction Center (HPC) produces quantitative precipitation forecasts (QPS) for
the NWRFC on a six hour time step which is the synoptic time step of the river forecast model.
Figure 15 shows the location of the QPS points in northwest Washington. HPC precipitation
forecasts are reviewed and possibly adjusted by forecasters at the Seattle WFO and the NWRFC
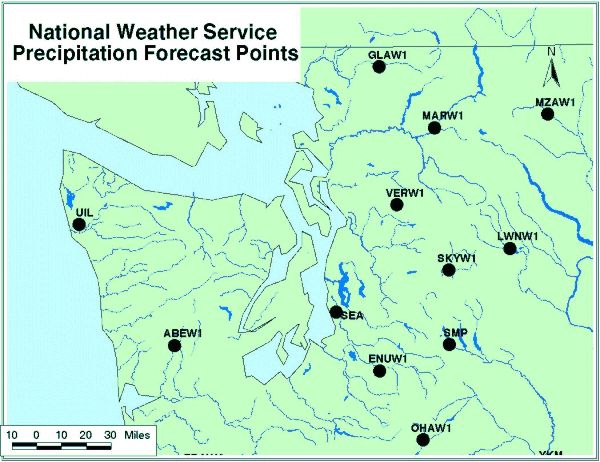 Figure 15 QPS Forecast Points in Northwest Washington.
prior to be input into the hydrologic model. Figures 16 through 26 display the northwest Washington QPS forecasts that were produced with one, two and three days lead time along with the observed precipitation for that day. Model runs are typically made in the morning, so forecast days begin at 12Z (5:00am PST).
Plots indicate that precipitation for the second flood event was under forecsted, especially during the latter part of October 20th and early October 21st.
 Figure 16 Forecasted and Observed 6 Hour Cumulative Precipitation for Quillayute.
 Figure 17 Forecasted and Observed 6 Hour Cumulative Precipitation for Aberdeen.
 Figure 18 Forecasted and Observed 6 Hour Cumulative Precipitation for Frances.
 Figure 19 Forecasted and Observed 6 Hour Cumulative Precipitation for Glacier.
 Figure 20 Forecasted and Observed 6 Hour Cumulative Precipitation for Marblemount.
 Figure 21 Forecasted and Observed 6 Hour Cumulative Precipitation for Verlot.
 Figure 22 Forecasted and Observed 6 Hour Cumulative Precipitation for Skykomish.
 Figure 23 Forecasted and Observed 6 Hour Cumulative Precipitation for Seattle.
 Figure 24 Forecasted and Observed 6 Hour Cumulative Precipitation for Enumclaw.
 Figure 25 Forecasted and Observed 6 Hour Cumulative Precipitation for Stampede Pass.
 Figure 26 Forecasted and Observed 6 Hour Cumulative Precipitation for Cinebar.
Stream Flow Forecasts
Flood Lead Times
The following tables contain the amount of lead time provided by NWRFC forecasts which indicated that a flood or major flood was going to occur. For each event, lead times for the Nooksack, Skagit and Skokomish rivers were greater than one day for most sites. Flows for the Elwha River for both events tend to be under forecasted causing the lead time to flooding to be short or missed. During the second event the band of heavy precipitation slid further south than forecasted, so QPS that was input to early model runs for the Snohomish and Satsop basins were much lower than actual precipitation. As a result flood flows were not forecasted until headwater gaging stations indicated steeper than forecasted rises. The Tolt River reached flood stage before a flood forecast could be issued and flood forecast lead times for other sites within those basins were relatively short.
Table 4 Flood Lead Times for October 17th Event.
OCT 17 EVENT |
||||||||||
NWS |
Flood Occurrence |
Major Flood Occurrence |
||||||||
Forecast |
Forecast Created |
Flood Initiation |
Lead |
Forecast Created |
Flood Initiation |
Lead |
||||
Site ID |
Date |
Time(Z) |
Date |
Time(Z) |
Time (hr) |
Date |
Time(Z) |
Date |
Time(Z) |
Time (hr) |
DEMW1 |
15 Oct |
1618 |
17 Oct |
0630 |
36 |
17 Oct |
0355 |
17 Oct |
1315 |
9 |
NKSW1 |
16 Oct |
1508 |
18 Oct |
0700 |
40 |
|
|
n/a |
|
|
CONW1 |
16 Oct |
1727 |
17 Oct |
0930 |
16 |
17 Oct |
0221 |
17 Oct |
2215 |
20 |
MVEW1 |
16 Oct |
1727 |
18 Oct |
0455 |
35 |
|
|
n/a |
|
|
SRPW1 |
15 Oct |
1527 |
16 Oct |
2100 |
30 |
|
|
n/a |
|
|
ELWW1 |
16 Oct |
2256 |
17 Oct |
0000 |
1 |
17 Oct |
0302 |
17 Oct |
0200 |
missed |
Table 5 Flood Lead Times for October 21th Event.
OCT 21 EVENT |
||||||||||
NWS |
Flood Occurrence |
Major Flood Occurrence |
||||||||
Forecast |
Forecast Created |
Flood Initiation |
Lead |
Forecast Created |
Flood Initiation |
Lead |
||||
Site ID |
Date |
Time(Z) |
Date |
Time(Z) |
Time (hr) |
Date |
Time(Z) |
Date |
Time(Z) |
Time (hr) |
|
DEMW1 |
19 Oct |
1627 |
21 Oct |
0215 |
34 |
|
|
n/a |
|
|
CONW1 |
19 Oct |
1944 |
20 Oct |
2100 |
25 |
20 Oct |
1541 |
20 Oct |
2345 |
8 |
MVEW1 |
20 Oct |
1541 |
21 Oct |
0900 |
18 |
20 Oct |
1541 |
21 Oct |
1545 |
24 |
GLBW1 |
20 Oct |
2030 |
20 Oct |
2330 |
3 |
21 Oct |
0250 |
21 Oct |
0315 |
0.5 |
SQUW1 |
20 Oct |
2030 |
21 Oct |
0630 |
10 |
|
|
n/a |
|
|
TOLW1 |
20 Oct |
2221 |
20 Oct |
2130 |
missed |
|
|
n/a |
|
|
CRNW1 |
20 Oct |
2030 |
21 Oct |
1030 |
14 |
|
|
n/a |
|
|
MROW1 |
21 Oct |
0425 |
21 Oct |
1100 |
6 |
21 Oct |
0425 |
21 Oct |
1630 |
12 |
SNAW1 |
21 Oct |
0425 |
21 Oct |
1230 |
8 |
|
|
n/a |
|
|
SRPW1 |
18 Oct |
1114 |
20 Oct |
1615 |
53 |
20 Oct |
1503 |
20 Oct |
2315 |
8 |
ELWW1 |
20 Oct |
1749 |
20 Oct |
1900 |
1 |
20 Oct |
1749 |
21 Oct |
0230 |
9 |
SATW1 |
20 Oct |
2157 |
21 Oct |
0000 |
2 |
|
|
n/a |
|
|
Peak Stage Forecasts
Nooksack Basin
Six days prior to the October 17th event, long range forecasts indicated that a sizable runoff event was going to occur in the Nooksack basin. Peak stage values were accurately forecasted 1 to 2 days prior each event.
Skagit Basin
Unlike the Nooksack Basin, stream flow in the Skagit Basin is affected by reservoir regulation. There are five major dams within the Skagit Basin but most of the storage capacity is behind the Upper Baker and Ross dams. The NWRFC produces inflow forecasts for these two reservoirs and routes the reservoir outflow downstream. The largest unregulated tributary of the Skagit River is the Sauk River. Peak stage for the first event was accurately forecasted one day before the event. Forecasts for the second event, which was the largest event recorded for the site, tended to be less than the observed peak. Forecasts were updated five times during the 24 hour period prior to the river cresting. Each update was made to account for river stages rising faster than the previous forecast. Rainfall in excess of the forecasted QPS appears to be the primary reason for under forecasting stage.
Subsequent reservoir inflow forecasts are less consistent than stream flow forecasts due to the quality of observed inflow data, which was used to set the initial conditions for the model runs. Observed data is highly variable due to the inherent difficultly in measuring reservoir inflow. Also, only average daily inflow data for reservoirs was being electronically sent to the RFC. During the event, hourly inflow data was obtained over the phone from the Army Corps of Engineers and dam operators.
Forecasted inflows for both reservoirs tended to converge toward the observed peak of the first event, though a couple forecasts for Upper Baker tended to be a little excessive. This was the result of bad or missing inflow observations that were corrected as additional observations were received. Forecasts for the second event tended to be less accurate. Upper Baker inflow was over forecasted due to the lack of hourly inflow data, while Ross Reservoir inflow was under forecasted. Like the Sauk River forecasts, under forecasting of Ross was due primarily to under forecasted QPS
Peak stage for the Skagit River at Mt. Vernon tended to be over forecasted prior to the first runoff event. The model which incorporates routing procedures and local flow inputs indicated that the river stage was going to peak around 30 to 38 feet. The river actually peaked at 29.1 feet. Forecasts for the second event were adjusted to account for this bias, making the forecasts for the second event within a few feet of the observed peak.
Snohomish
Within the Snohomish Basin, the NWS has river forecast points on the Tolt, Snoqualmie, Skykomish and Snohomish rivers. Prior to the first event, flooding was initially forecasted for these rivers because the heavy precipitation fetch was forecasted to extend south over the basin. The heavy rains did not drop that far south, causing river flows to be over forecasted for the October 17th event. The opposite situation occurred during the October 21st event. Initial forecasts did not indicate that high flows would occur within the basin. Precipitation ended up falling at a much greater intensity and longer duration than was forecasted causing the NWRFC to update forecasts showing river stage levels going above flood stage.
Olympic Peninsula
Peak stage forecasts for the Skokomish River near Potlatch indicated that severe flooding was eminent two days prior to the first event. Major flooding was forecasted for both events, though the October 17th event fell shy of major flood stage by a few tenths of a foot.
Forecasts for the Elwha River were much lower than the observed peaks during both events. The Elwha Basin is located on the north side of the Olympic Mountains, but the QPS forecast points, Aberdeen and Quillayute, for this basin are located on the west coast of the peninsula. During this event precipitation in the Elwha Basin was not accurately forecasted by those sites. As a result both flood and major flood forecasts were only predicted after stream flow data showed that the river was rising much faster than forecasted.
Chehalis River Basin
Heavy precipitation was confined to the northern portion of the Chehalis Basin, primarily the Wynochee and Satsop basins. Like the Snohomish Basin, the October 21st event was larger than forecasted because the fetch of heavy precipitation slipped farther south than forecasted.