REVIEW OF APRIL 2006 WEISER RIVER FLOOD EVENT
EXECUTIVE SUMMARY
The Weiser River has a history of frequent, flashy flood events. A series of flood events occurred during the first week of April 2006. The Northwest River Forecast Center provides river forecasts for the Weiser River near Cambridge and downstream at the Weiser River near Weiser. Flood forecasts were issued from the NWRFC for all of these events, however in the case of the event on April 4, the forecast timing indicated that flooding wouldn't occur for approximately two days. Instead the Weiser flooded within 24 hours. In addition the forecast peak was more than one foot below the observed flood peak. As a result of the forecast, the NWRFC was not staffed in the early hours when the Weiser went above flood.
This report reviews the event from the perspective of the NWRFC. Recommendation for improvements are given in the conclusion and, if accepted, should aid to NWRFC to provide more accurate forecasts for the Weiser in the future.
WEISER BASIN DESCRIPTION
The Weiser River basin is situated at the southern end of the Seven Devils Mountains in central Idaho. The drainage area of the Weiser basin is 1660 square miles and the river runs 112 miles from its source south to the confluence with the Snake River. The soils range from shallow to very deep and are well drained with moderate permeability. The soils support Ponderosa Pine and conifers in the higher elevations. Of special note, Riggins soils are present on the steep, south facing slopes in the Weiser drainage. Riggins soils permit very rapid runoff during heavy rain/melt events on the Weiser River (Idaho Department of Environmental Quality-Weiser basin SBA TMDL, June 2004).
WEISER BASIN HYDROLOGY
The Weiser River is susceptible to flooding in both the winter and early spring.
Floods are usually a combination of rainfall runoff augmented by
snowmelt. The peak of record at Weiser during the historical period was
the flood of January 1997 with a flow of 34,500 cubic feet per second (cfs).
Flood peaks have occurred as early as November and as late as April. The
Weiser basin has a southerly aspect. This means that storms moving out of
California and Nevada carrying warm, moist unstable air are funneled into the
headwaters of the Weiser river drainage. With this trajectory, a
significant orographic enhancement of precipitation occurs. Lower valley
sites catch 15 to 20 inches annually while the headwaters areas receive 50 to
75 inches (From Oregon State University PRISM analysis). In individual
storm events, the lower Weiser valley may catch .50 inches of rain while the
nearby mountains may receive 1 to 3 inches of rainfall.
During the January 1997 flood on the Weiser River, the precipitation gage at Weiser 2SE recorded 0.96 inches of rain on the peak day of the flood. Weiser 2SE has an elevation of 2120 feet. Another site, Cambridge at 2650 feet elevation, measured 2.31 inches of rain. Cambridge is in the foothills of the Seven Devils Mountains and undoubtedly heavier rainfall fell at higher elevations. Another important observation about the Weiser river hydrology is the fact that storm rainfall is short lived and intense. A typical storm will see 60 to 80 percent of the storm rainfall occur in 6 to 9 hours. This short duration rainfall determines the flood peak timing. Forecasting the intensity of the rainfall correct in a flood event is critical to the flood warning program.
The other important contribution to Weiser River flooding is the snowmelt
volume. During typical flood events, freezing levels are often pushed up
to 7,000 to 8,000 feet by the warm southerly winds. Warm temperatures,
steady southerly winds and high dew points combine to melt snow at high
rates. Warm rain falling into the existing snowpack further contributed
to the runoff volume. This snowmelt runoff adds substantially to the
downstream flood volume. In a typical storm Natural Resource Conservation
Service (NRCS) SNOTEL sites may lose 1 to 2 inches of water equivalent during a
storm event.
WEISER RIVER CONDITIONS WY 2006
Except for the month of February 2006, recent months leading up to the April flood event were above average in precipitation. Amounts in the Weiser River area ranged from 115 percent in December to 183 percent in January. Temperatures during this period were slightly below average except for the month of January where temperatures were 3 to 5 degrees above average.
Snowpack increased throughout the early winter into spring with water equivalents ranging from 130 to 160 percent of the 30-year average. Streamflow for the Weiser River was above average all winter and early spring. December and January flows were especially high, 227 and 308 percent of average, respectively. The information above points to the fact that soil moistures were above average in the Weiser river basin and that the existing snowpack was holding more moisture than in an average year.
The initial flood event on the Weiser River for the water year 2006 was in
December when heavy rain and some snowmelt brought the river level above flood
stage. During January Weiser River flows remained high, but below flood
levels. In February, cooler, drier weather allowed streamflows to recede
to slightly below average levels. This set the scene for the flood events
during March and April. The next flood occurrence on the Weiser River
occurred in late March. The prevailing storm track shifted from westerly
to a southerly track with unstable, moist air moving into Idaho from the
South. In a twenty-four hour period on March 25th up to an inch of rain
was reported at several NRCS SNOTEL sites and also at some Bureau of Land
Management (BLM) RAWS sites. Seventy percent of the rainfall accumulated
in one six hour period, with the balance of the rain falling in the previous
six hours. The heavy rain and some snowmelt pushed the Weiser River approximately
1.5 feet above flood stage. Moist southerly flow continued, keeping the Weiser
River between 8.0 and 10.0 feet leading up to the April flood event.
THE APRIL 3-6, 2006 METEROLOGICAL SUMMARY
The general weather pattern influencing the Pacific Northwest through the first week of April 2006 was driven by a stationary, vertically stacked Eastern Pacific low off the coast of southwestern Oregon (Fig. 1). The upper level low in this case frequently propagated surface low pressure centers inland along the rim of the Great Basin (white contours in Fig. 2 depict mean sea level pressure early Wednesday morning April 5th, while 500mb heights are plotted as black contours). These surface lows tended to track north/northeastward along a fairly stationary north-south thickness gradient over eastern Oregon and western Idaho; this thickness gradient and associated upper level transient jet maxima provided synoptic scale dynamic lift to focus widespread convective showers over this south-central interior forecast area.
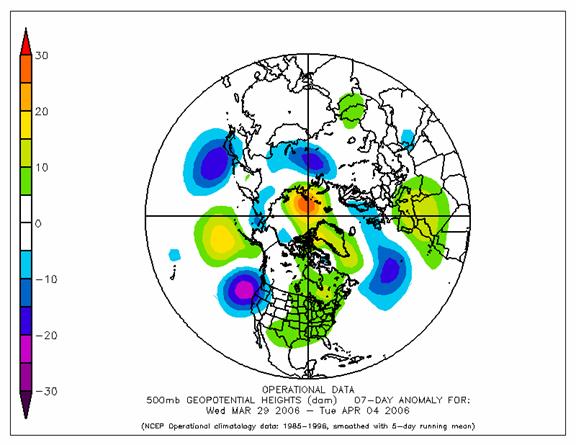
Fig. 1. 500mb geopotential height 7 day anomaly for 3/29/06 - 04/04/06.
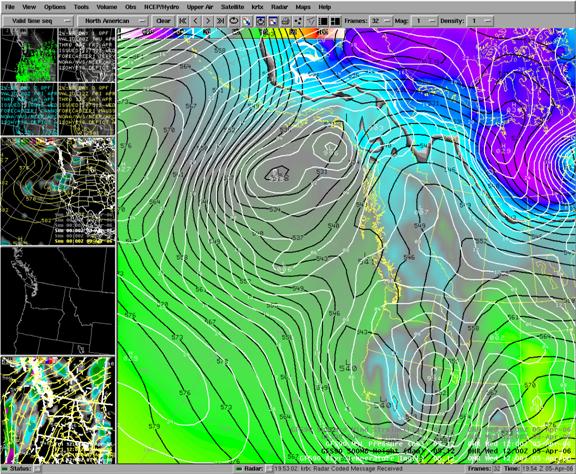
Fig. 2. GFS MSL pressure (white contours) and 500mb heights (black contours) analysis for 04/05/06 12:00 UTC.
Fig. 3 displays composite reflectivities during the morning of Wednesday April 5th across the NWRFC; 18Z GFS 1000-500mb thickness lines are dashed white plotted lines, and yellow text displays hourly observed precipitation rates (typically around 0.01 to 0.05 inches per hour at 16:24 UTC on April 5th). As warmer southwesterly flow advected along this thickness gradient, local afternoon temperatures climbed above 60 degrees, thus further destabilizing south-central interior locations sufficiently to initiate scattered moderate to strong afternoon convection that occasionally lingered into early morning hours through the middle of the first week of April.
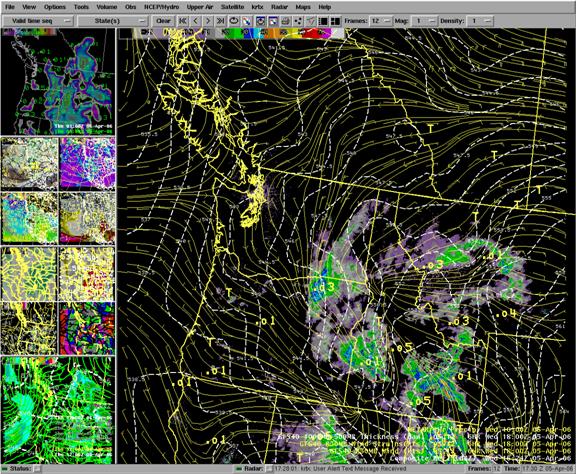
Fig. 3. Composite radar reflectivities at 16:34 UTC 04/05/06, with 16:00 UTC hourly precipitation accumulations (yellow text), and GFS40 six hour 1000-500mb thickness forecast valid 18:00 UTC 04/05/06.
The upper right display panel in fig. 4 depicts the enhanced Wednesday morning April 5th GFS 700 mb deformation and temperature gradient along the eastern Oregon and western Idaho border. The upper left display panel indicates increased water vapor concentration over this same area - with observed lightening strikes trailing off across the upper Snake. Fig. 5 is a combined 20 day plot of observed 10 day temperatures and dewpoints prior to April 5 (left of center), while forecast temperatures for 10 days are plotted to the right of center (the center of the plot represents the morning of Wednesday April 5, 2006). The four index sites selected for use in this plot are Yakima, Spokane, Mulan Pass, and Kalispel.
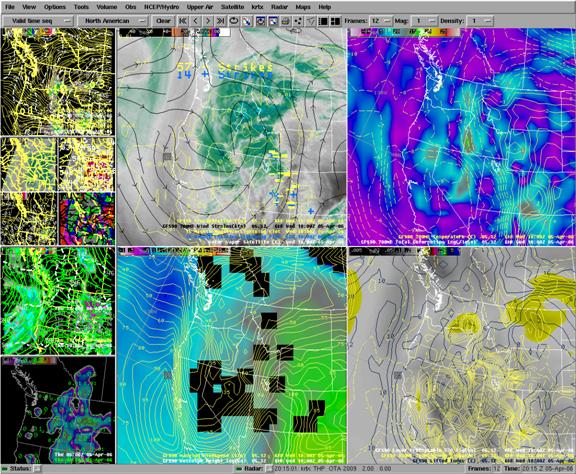
Fig. 4. Water vapor satellite imagery valid at 18:00 UTC on April 5,2006 (upper left panel), with matched GFS six hour forecast 700 mb deformation and temperature.
Note the critical transition in Fig. 5 where the steady increase of both daily observed dewpoint and daily forecast minimum temperatures reach above 32 degrees F (32 deg F represented by the horizontal red line) occurs on Tuesday night April 4, 2006 (for reference scaling perspective, the horizontal blue line is plotted at 20 degrees F). Also note the forecast peak in this warming trend around Thursday April 6, 2006. The orange thick lined box (centered on Wednesday April 5) outlines dewpoints that have climbed above 32 degrees F at all four selected index sites. Mullan Pass, the highest index site in this analysis, has an elevation 6070 feet and is located approximately 170 miles away from McCall, Idaho. It is the coolest forecast temperature plotted in Fig. 5 and is a useful first-order approximation of the thermal characteristics for the Weiser basin headwater through this event.
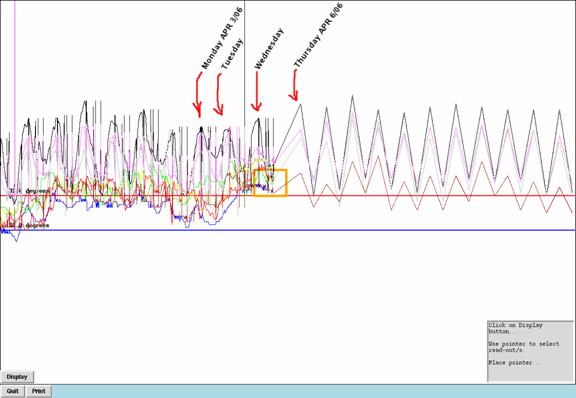
Fig. 5. Combined 20 day plot of observed 10 day temperatures and dewpoints prior to April 5 (left of center back to March 28th), with forecast temperatures for 10 days out to April 16th (plotted right of center). The center of the plot, represents the morning of Wednesday April 5, 2006).
The rise in temperatures and dewpoints through the middle of the first week of April created unstable afternoon surface Lifted Index values of approximately -2.0 to 0.0 across eastern Oregon and southwestern Idaho and resulted in local sharp snowmelt runoff responses for the middle Snake basins. These snowmelt responses, combined with isolated-scattered 1 to 2 inch daily convective rain showers, resulted in Weiser basin flows rising above flood stage (Fig. 6 depicts observed daily 1 to 1.5 inch [in yellow filled contours] local maximum precipitation accumulations on April 4, 2006, scattered from the Owyhee Mountains, across the Boise area, and into the Sawtooth Mountains).
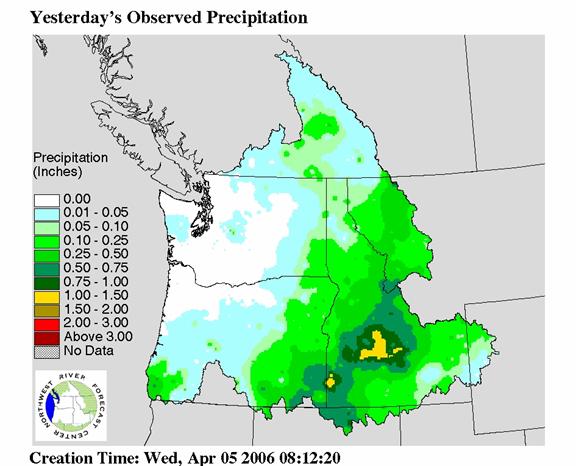
Fig. 6. 24 hour observed precipitation across the NWRFC from 04/04/06 12:00 UTC to 04/05/06 12:00 UTC.
The primary difficulty in forecasting QPF through this active first week in April across the Boise area was attempting to refine the placement and amount of isolated to scattered embedded heavy convection. Using GFE, warmer WFO ISC temperature grids were used to successfully improve upon TDL MOS forecast temperatures, particularly across the Boise forecast area where observed temperatures increasingly remained above freezing around the middle of the first week in April (fig. 5). Thus, ripening of snow in the Weiser drainage was probably modeled in NWSRFS reasonably well. However, although WFO ISC guidance tended to nudge precipitation to higher values than either HPC or NCEP model guidance, no available source of forecast QPF guidance correctly anticipated local heavy occasional daily 1 to 2 inch rains across the Weiser headwaters through critical parts of the first week in April.
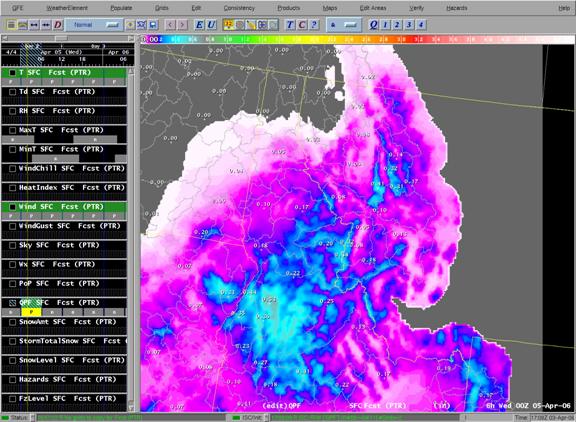
Fig. 7. Observed 04/04/06 18:00 UTC to 04/05/06 00:00 UTC 6 hour precipitation.
HPC, NCEP, and ISC guidance all appeared to lack consistency and sufficient skill in forecasting the positioning and amounts of the most significant daily precipitation - precipitation that resulted in the sharpest hydrologic responses in the middle Snake forecast area (see fig. 7 - depicting observed 04/04/06 18:00 UTC to 04/05/06 00:00 UTC 6 hour precipitation). These circumstances reduced much of the precision in our forecast problem to a nowcast, flashflood type of exercise. For example, compare the following model inconsistencies to observed precipitation.
Fig. 8 is the daily 24 hour observed precipitation from 12:00 UTC Wednesday morning April 5, 2006 to 12:00 UTC Thursday morning April 6, 2006. The NWRFC attempts to model this complex pattern using the sparse array of points illustrated in fig. 9. The difficulty in forecasting the placement and amount of the observed precipitation (fig. 8) with this type of sparse point array (fig. 9) was significantly compounded by the lack of consistency in available NCEP model guidance, as illustrated in the following figures. Fig. 10 depicts the six hour precipitation accumulation forecast from the 04/05/06 12:00 UTC GFS model run with a 6 hour forecast period ending at 04/06/06 00:00 UTC. Fig. 11 is the 04/05/06 18:00 UTC NAM model run 3 hour precipitation accumulation forecast for a three hour period valid for the period ending at 04/06/06 00:00 UTC - the same period ending time in fig. 10.
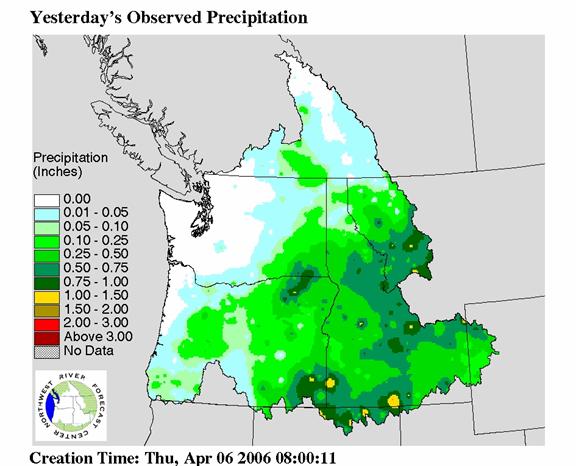
Fig. 8. Daily 24 hour observed precipitation from 12:00 UTC Wednesday morning April 5, 2006 to 12:00 UTC Thursday morning April 6, 2006.
In terms of QPF comparison, the NAM model correlates fairly well with the GFS model in capturing local rain concentration detail around northeastern Oregon in the Pendleton forecast area, but in this case the NAM solution more correctly limits the extent and amount of QPF (more closely matching observed precipitation in fig. 8). However, the GFS model appeared to outperform the NAM model (even though it was initialized 6 hours prior to the NAM model solution in this example) in placing the more widespread local heavy rain that was observed across the far southwestern corner of Idaho. The above comparison is not exhaustive, but is included here simply to illustrate the consistency problem forecasters faced in assessing QPF for the Weiser basin through the first week of April 2006.
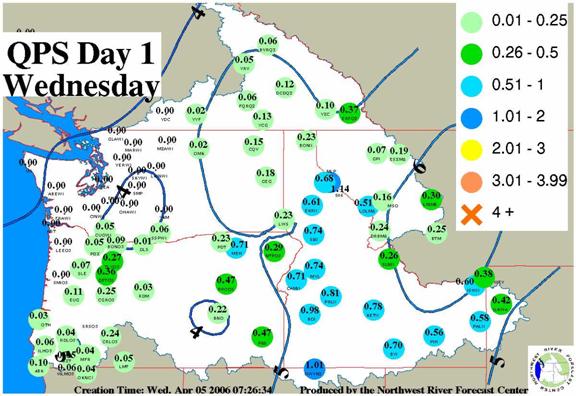
Fig. 9. QPF Point forecasts for Wednesday 04/05/06 12:00 UTC to 04/06/06 12:00 UTC.
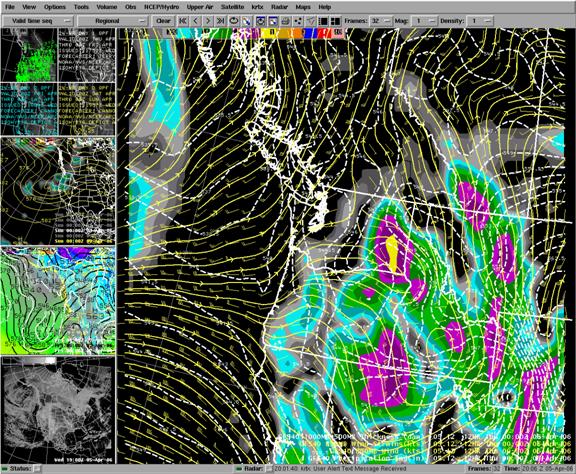
Fig. 10. Six hour QPF forecast of the 04/05/06 12:00 UTC GFS model run with a 6 hour forecast period ending at 04/06/06 00:00 UTC.
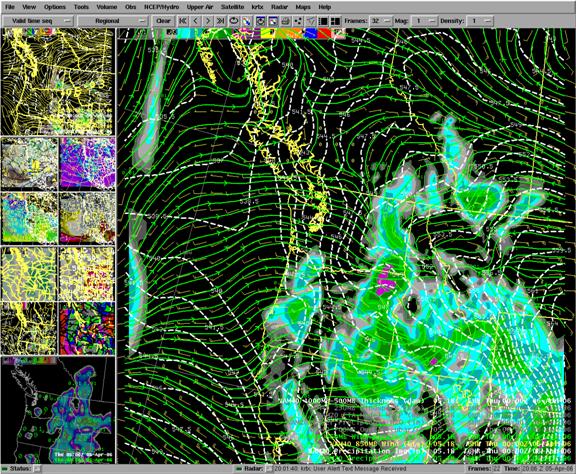
Fig. 11. 04/05/06 18:00 UTC NAM model run 3 hour QPF for a three hour period ending at 04/06/06 00:00 UTC.
In the above 04/05/06 example, neither model (or ISC grids) were able to resolve the isolated mesoscale instances of scattered 1 plus inch rains that were observed locally in parts of the Weiser headwaters. This is typical, primarily because of the limited number of surrounding forecast precipitation points that by themselves are insufficient for the purposes of deriving an NWSRFS FMAP that physically represents real meso to micro scale precipitation patterns across the Weiser basin. The Weiser CAMI1 and WSRI1 forecast segments in NWSRFS take this limitation to extremes in that FMAPS for these two subbasins depend solely on precipitation forecasts for McCall, Idaho.
Fig. 12 is a terrain image with basin boundaries at a 3 mile by 3 mile resolution. It depicts the existing spatial forecast problem in modeling the Weiser basin (outlined in white). Although the centroid of the combined CAMI1 and WSRI1 area is only around 29 miles southwest of McCall, there are surprising contrasts between McCall and the two Weiser forecast points CAMI1 and WSRI1. McCall, Idaho, the only current QPF point used to initialize FMAPs for CAMI1 and WSRI1, is located 32 miles to the northwest of the CAMI1 river gauge and is at an elevation 2,370 feet higher than the CAMI1 gauge. The WEII1 river forecast point is 52 miles southwest of McCall and is 2824 feet lower than McCall.
Note the elevation scale in the far upper left of fig. 12 (6000-7000 feet is referenced via the red color band). A 6000-7000 foot (red) ridgeline in the center-right of fig. 12 forms a distinct barrier between McCall and the Weiser CAMI1 and WSRI1 subbasins. It is also somewhat evident that the Weiser basin has a preferred southwesterly drainage or slope-aspect, while the valley that McCall is situated in has a separate southward slope-aspect/orientation.
In retrospect, after considering details annotated in fig. 12, it is difficult for the FMAP process of NWSRFS to produce physically sound forecasts in the Weiser drainage. The data sparseness problem in this case (as well as in other nearby middle Snake basins) is also clearly complicated by the rapidly varying extremes in middle Snake basin terrain elevation and slope-aspect.
Thus it seems obvious that simply having more forecast points with which to model the Weiser basin could be an improvement over current methodology. However, gains would only be fully realized if the QPS for possible additional forecast points was substantiated with reliable surface observations. Expecting an interpolation tool such as GFE to improve the quality of existing sub-grid FMAT and FMAP initializations without additional surface initialization and verification data would be to reduce QPS to a synthetic type approach (i.e., GFE may well be better to use at times - compared to the existing methodology; but questions would remain on those occasions as to whether the benefit resulted from any increase in skill, or just coincidence, and whether the average GFE errors exceeded those of the existing methodology).
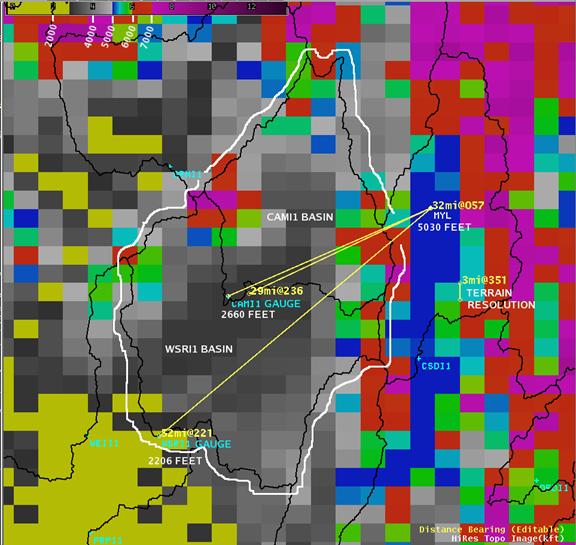
Fig. 12. AWIPS D2D terrain elevation data (3 mile by 3 mile resolution) image with basin boundaries centered on the Weiser forecast subbasins CAMI1 and WSRI1.
THE APRIL 3-6, 2006 FLOOD EVENT
The meteorological conditions discussed above produced heavy rainfall and warm
temperatures ideal for producing snowmelt runoff. In a twelve hour period
from late on April 3rd until the afternoon of the 4th of April, 0.75 to 1.10
inches of rain was reported at several NRCS SNOTEL and BLM RAWS
sites. Radar estimated precipitation from the Boise Weather Forecast
Office (WFO) indicated heavier amounts of rain in the mountains. As with
other similar storms, 70 percent of the reported precipitation fell in the
first 6 to 10 hours. Several SNOTEL sites reported losses of 1.0 to 1.5
inches of snow water equivalent during the event. The rain and snowmelt
brought the Weiser River rapidly above flood stage. The river continued
to rise and crested above flood stage at 11.36 feet at 0200 UTC on April 5th.
The river receded slightly and then, pushed by further rainfall and snowmelt,
rose to 11.62 feet at 0100 UTC on April 6. SNOTEL and RAWS precipitation
sites reported 0.40 to 0.60 inches of rain during the second event. The actual
rainfall for the April 4-6 period is shown on Figure 13.
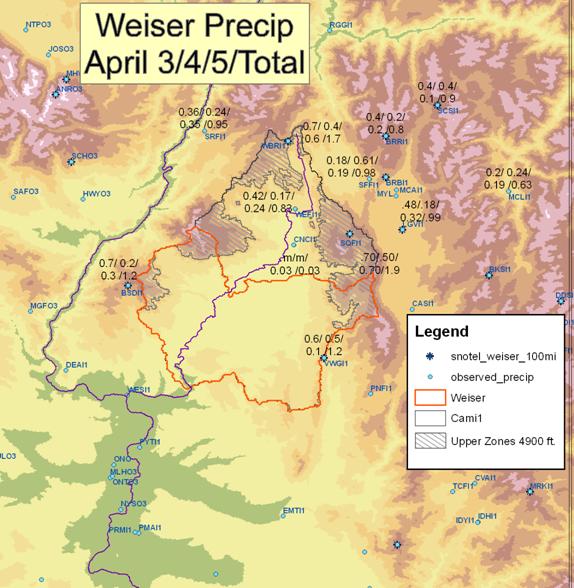
Figure 13. Weiser Basin Observed Storm Precipitation. Amount shown reflect 24-hr precipitation amounts for April 3rd, 4th, and 5th, followed by the 3 day storm total in inches.
QPF VERIFICATION FOR THE WEISER RIVER FLOOD
Graphs 1-5 show the QPF verification during the April flood event for gages at Burns
and Rome, Oregon and Boise, McCall, and Burley, Idaho. Currently, the Weiser River
is modeled by NWSRFS using McCall precipitation forecasts as the sole
determinate for estimating mean areal precipitation (FMAP) amounts. The
QPF made on April 3rd produced Weiser basin forecasts of .20 to .30 tenths of
an inch on April 4th and then amounts of .50 to .60 inches on April 5th and
6th. The six hour distribution of precipitation for the three day period
showed fairly equal amounts in every 6 hour period. In the actual storm
event heavy rain (.70 to 1.20 inches) began falling late on April 3rd
and continued into the morning of the 4th of April. From the afternoon of
the 4th of April until the morning of the 5th very little precipitation
fell. Then on the 5th of April another .40 to .60 inches of rain fell.
The QPF issued on the 3rd failed to portray the heavy burst of rain that fell
late on the 3rd and overestimated the rainfall on the 4th of April. Significantly,
the distribution of precipitation in the QPF for April 3rd did not reflect
later observations.
Chart 1. Storm Verification for the Burns Precipitation Gage.
Chart 2. Storm Verification for the Rome Precipitation Gage.
Chart 3. Storm Verification for the Boise Precipitation Gage.
Chart 4. Storm Verification for the McCall Precipitation Gage.
Chart 5. Storm Verification for the Burley Precipitation Gage.
NWRFC WEISER RIVER FLOOD OPERATIONS APRIL 3-6, 2006
The NWSRFS model forecast issued on April 3rd at 1546 UTC with the
QPF input mentioned above produced the forecast shown in Graph 1. The
forecast for the Weiser near Weiser described a gradual rise and an expectation
that flood stage would be exceeded at 0600 UTC April 5 with a peak occurring at
1200 UTC on April 6. In fact, the heavy rain began around 0600 UTC on
April 4, pushing the Weiser above flood stage by 1130Z on April 4 and rising to
nearly two feet over flood stage approximately 12 hours later. The QPF
input on April 3rd and the resultant Weiser River streamflow forecast were
woefully inadequate.
Graph 1. Observed Stage and 1546 UTC, 4/3/06 Forecast Hydrograph for the Weiser River from 3/24/06 though the flood peak of 4/6/06.
A NWRFC hydrologist worked until 6:00 pm PST on Tuesday, the 3rd of April (0200 UTC 4/4/06). No evidence of the coming heavy rain and rapid rise to flood stage was apparent. At midnight on the 3rd, the Boise WFO tried to contact NWRFC Portland by phone, but ended up reaching the co-located Portland WFO. The Boise WFO then issued a flood warning for the Weiser River. The NWRFC morning crew began duty at 1300 UTC on April 4th and noticed immediately that the Weiser River had risen past flood stage.
A quick model run was made for the Weiser. Based upon surrounding SNOTEL reports, an inch of rain was input for the six hour period ending 1200 UTC on April 4, with lesser precipitation amounts input for the following two six hour periods. This produced a forecast rise to about two feet over flood stage for 0000 UTC on April 5 and this forecast was sent to WFO Boise (Graph 2). Later forecast updates by the NWRFC indicated a slight drop in streamflows on the Weiser from the afternoon on the 4th into the morning of the 5th (Figure 3) and then a second rise, going more than two feet over flood stage on the afternoon of 5th of April (Figure 4).
Graph 2. Observed Stage and 1317 UTC, 4/4/06 Forecast Hydrograph for the Weiser River from 3/24/06 though the flood peak of 4/6/06.
Graph 3. Observed Stage and 0205 UTC, 4/5/06 Forecast Hydrograph for the Weiser River from 3/24/06 though the flood peak of 4/6/06.
Graph 4. Observed Stage and 1100 UTC, 4/5/06 Forecast Hydrograph for the Weiser River from 3/24/06 though the flood peak of 4/6/06.
POST ANALYSIS OF THE NWSRFS MODEL PERFORMANCE ON THE WEISER RIVER
An analysis was performed on the performance of the Weiser River forecast segment. One finding was that even with the correct event rainfall, the Weiser River model did not produce any direct runoff. Considering the discussion about Riggins soils on the south facing slopes, the Weiser basin needs recalibration to enable direct runoff during moderate to major flood events. A second consideration is the current construction of the Weiser hydrologic system within NWSRFS. We now model the Weiser River near Cambridge and the Weiser River near Weiser as separate headwater drainages. There is no upstream-downstream connectivity. An improvement would be to model the Weiser River as a headwater basin at Cambridge, then route that hydrograph to Weiser and add a modeled Weiser local. Finally, a review of the Weiser River calibration showed that most of the major peaks were under simulated. A recalibration can improve model performance at peak flows.