2005 Year End Floods
Introduction
Heavy rains between Christmas and New Year's caused flooding
from
Meteorological Summary
Typical seasonable rains (and mountain snow) incrementally
primed westside upper soil zones across western
(Weekly Summary: 12Z
DIVISION ..DEC TO DAY 19.. ...OCT
- DEC...
OBSD DEP
PCT AV OBSD DEP
PCT AV
SNAKE RV AB
ROGUE/UMPQUA 3.64 0.14 104.
13.74 1.89 116.
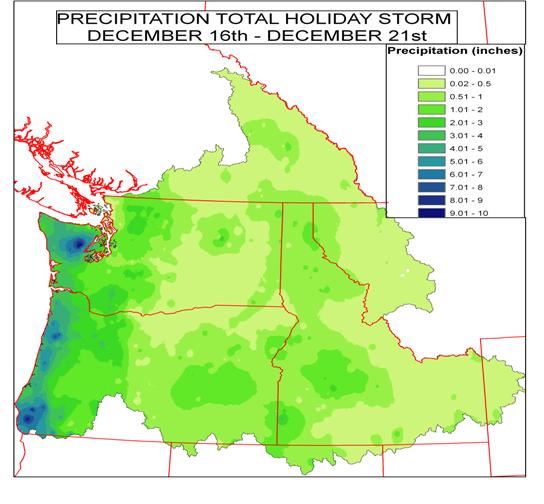
Figure 1. Six Day Accumulative Precipitation -
Near seasonable early to middle December weather was followed by a persistent very wet pattern resulting from an extended long wave length upper level trough and relatively uninterrupted jet-stream that advected a well defined continuous plume of 1 to 1.5 inch plus precipitable water from the vicinity of the Philippines (near the base of the long wave trough) northeastward on a track into the Pacific Northwest (Figure 2).
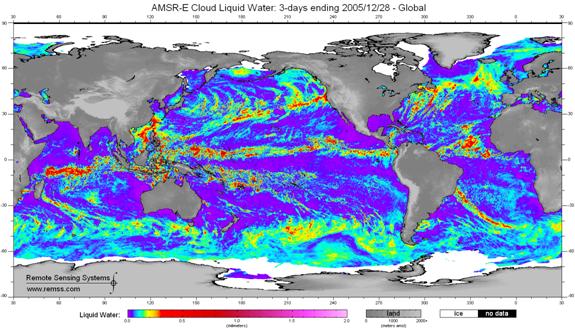
Figure 2. Global Integrated Cloud Liquid Water -
This fairly steady state late December cross-Pacific moist atmospheric pattern resulted in frequent training of unsettled wet weather, particularly into NWRFC coast range and Cascade headwaters. These storms had their greatest effect on NWRFC westside basins, however, this scenario gradually extended scattered 1 plus inch daily rains east of the Cascades as well (mainly into middle Snake River drainages across south-central Idaho).
Throughout this late December event period storms were
frequently accompanied by both strong low level (50 knot plus) and upper level (130
knot plus) jet streaks as individual baroclinic waves initially pushed onshore
into the
From December 22 to December 27, an almost uninterrupted
series of Pacific storm systems slowly sagged a pattern of intensifying rains
southward along the coast - starting across northwestern Washington (Figure 3,
forecast day-1 12/22/05 QPF) and then gradually stalling across southwestern
Oregon (Figure 4, forecast day-1 12/27/05 QPF).
Local moderate rains then spread across much of western
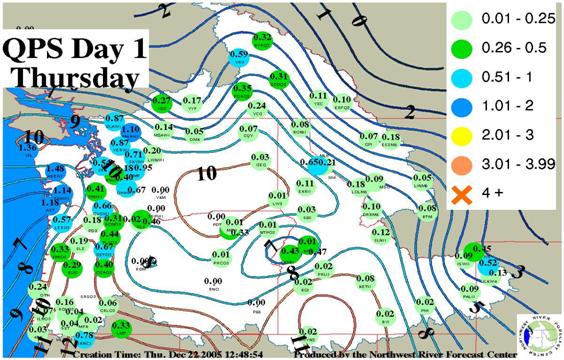
Figure 3. Forecast
day-1 12/22/05 Quantitative Precipitation Forecast
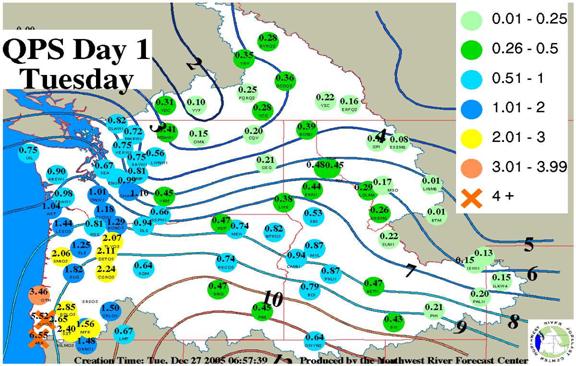
Figure 4. Forecast day-1 12/27/05 Quantitative Precipitation Forecast
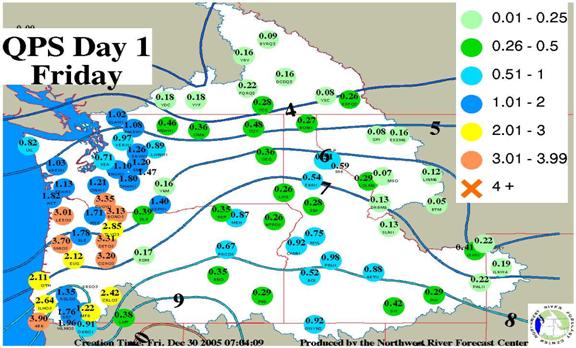
Figure 5. Forecast day-1 12/30/05 Quantitative Precipitation Forecast
The prolonged late December southwesterly fetch of slowly
modifying Western Pacific moist tropical air resulted in not only frequent
impulses of locally heavy westside rains, but also the advection of high dew
point warm air across much of the NWRFC forecast area (Figure 6). As a result, freezing levels occasionally
climbed up to 8000-11000 across southern
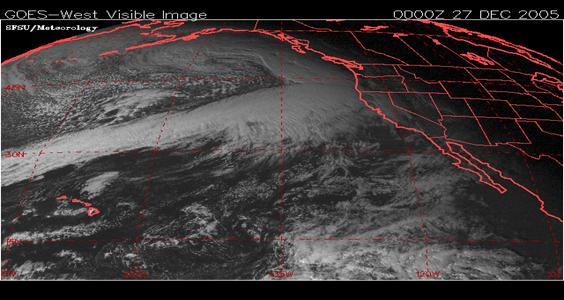
Figure 6. Visible Satellite Image -
By end of December 2005 observed precipitation across the
(Monthly Summary: - Dec 2005)
DIVISION ..DEC TO DAY 31.. ....OCT
- DEC....
OBSD DEP PCT AV
OBSD DEP PCT AV
SNAKE RV AB
ROGUE/UMPQUA 12.13 6.41 212.
22.23 8.17 158.
Figure 7. Monthly Precipitation Percent of
The heaviest precipitation fell across the NWRFC area
between
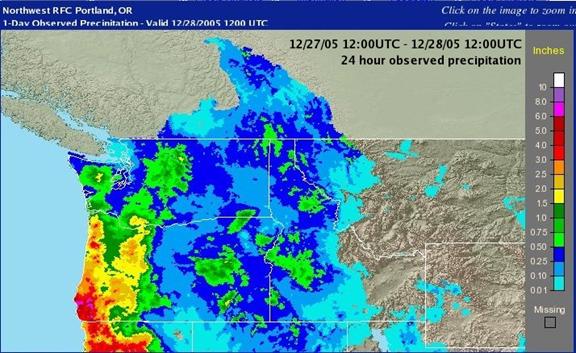
Figure 8. Storm Total
Precipitation December 22 - January 1st
Figure
9. 24 Hour Observed Precipitation -
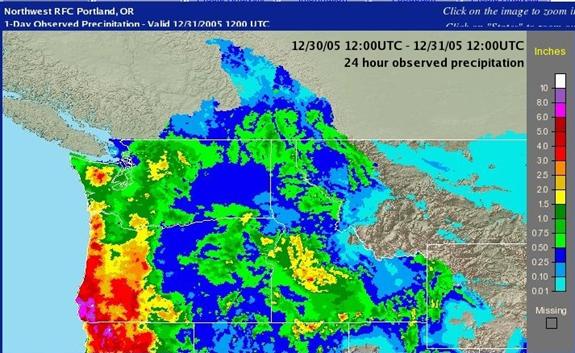
Figure 10. 24 Hour
Observed Precipitation -
Storm Precipitation
|
Daily Daily Storm Total |
|
NWS ID
NAME QPS SITE Dec 27 Dec 30 Dec 22-Jan 01 |
|
|
|
LAFO3 Lawson
RAWS 5.63
6.03 33.58 |
|
VLZO3 Valsetz
3.83 2.63
28.25 |
|
BKFO3 Bald Knob 2 4.46 4.65 28.03 |
|
ELKC1 |
|
LAMO3 |
|
CVFO3 |
|
ILHO3 Illahe QPS 4.00
4.80 23.70 |
|
GASC1 Gasquet RS 2.79 4.00
23.28 |
|
CVJO3 Cave Junction 3.47 4.13
23.08 |
|
GLBO3 |
|
GOLO3 Gold
Beach 3.63 3.91 22.24 |
|
4BK Brookings QPS 3.20
3.86 21.70
|
|
KRBO3* Kirby
3.21 3.79 21.57 |
|
SITO3 Sitkum 1E 3.57 3.73
20.62 |
|
LMDO3 Little Meadows SNOTEL 1.89 4.40
18.57 |
|
POWO3 SF Coquille R at Powers 2.91
2.96 17.68 |
|
MTHO3 Mt
Hood Test SNOTEL 2.48
4.13 16.83 |
|
MRFO3 |
|
GSVO3 Galesville Reservoir 2.52 1.57
14.00 |
|
SXT |
|
CRLO3 |
|
SCFO3 Salt Creek Falls SNOTEL 1.70
4.40 12.99 |
|
WLMO3* Williams
QPS 1.63
2.49 12.46
|
|
OTH |
|
SRSO3 Steamboat Ranger Station QPS
1.89 3.79
12.34
|
|
RDLO3 Cow Creek nr Riddle QPS
2.50 2.00 11.90
|
|
TILO3 |
|
BLBO3 Black |
|
BUFO3 SF Big |
|
EMIO3 Emigrant Cr nr |
|
MFR |
* Estimated
Table 1.
Flood Summary
Frequent, moisture rich, Winter storms on their own are not
unusual in the
Prior to December 19th,
The heaviest 24 hour precipitation periods occurred on December 27th and December 30th. This is coincidental with river rises on December 28th and December 31st.
Freezing levels remained high during the event therefore rain fell at most elevations. NRCS Snotel sites within the Rogue and Umpqua basins reveal that snow water equivalent measurements at sites below 5,200 feet fluctuated only a few tenths of an inch from December 22 - 31st. Snotel sites above 6,000 feet showed little change from December 22 - 30th, then increase approximately 1.5 inches of snow water equivalent from the 30th to 31st. This signifies that snow melt or rain on snow instances did not contribute greatly to the magnitude of the flood event (Table 2).
-----------------------------------------------------------------------------
BASIN ELEV. SNOW WATER EQUIVALENT TOTAL PRECIPITATION
Data Site Name (Ft) % %
Current Average
Avg Current Average
Avg
-----------------------------------------------------------------------------
Dec 22
BIG
BIGELOW CAMP 5120 .9
5.0 18 28.7
23.1 124
FISH LK. 4665
3.6 5.3 68
19.1 14.9 128
SEVENMILE MARSH 6200
13.5 11.2
121 26.3 22.1
119
----- -----
Basin wide percent of average 77
118
Dec 28
BIG
BIGELOW CAMP 5120 1.3
5.5 24 35.2
25.2 140
FISH LK. 4665 3.0
5.8 52 20.6
16.2 127
SEVENMILE MARSH 6200
14.9 12.5 119 29.6
24.1 123
----- -----
Basin wide percent of average 72 126
Dec 31
BIG
BIGELOW CAMP 5120 1.0
5.7 18
42.4 26.2 162
FISH LK. 4665 4.1
6.1 67 23.5
16.9 139
SEVENMILE MARSH 6200
17.7 13.2 134 35.9
25.2 142
----- -----
Basin wide percent of average 87 146
Table 2. NRCS Snotel observed snow water equivalent (Rogue
and
The flood portion of this report focuses on rivers where the National Weather Service provides river stage forecasts. Figure 11 is a display of locations where the National Weather Service produces river forecasts.
Flooding occurred in all of the major river basins of
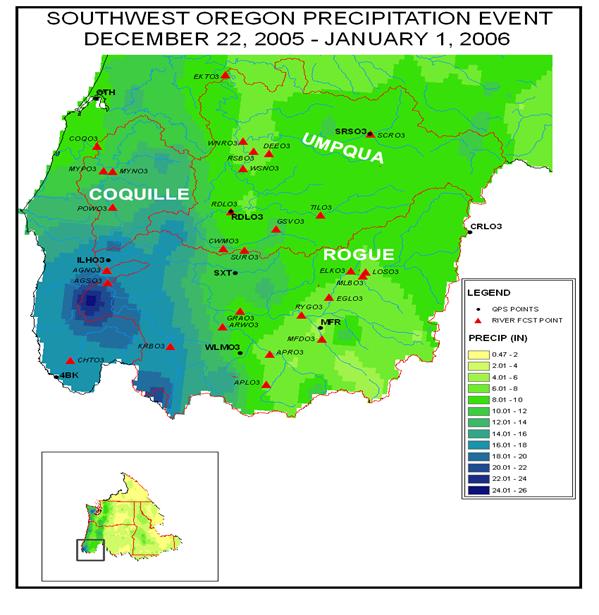
Figure 11.
Lost
Inflow into Lost Lake Reservoir exhibited a double peak in late December. Peak inflows for December 29th and 31st were approximately 8,000 cfs and 15,000 cfs (Figure 12).
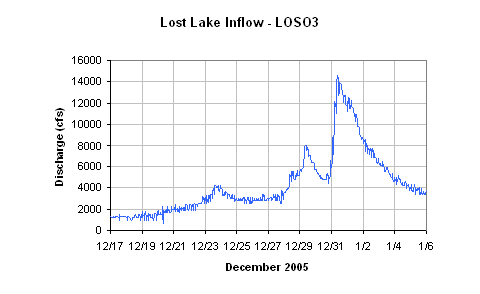
Figure 12. Inflow
Hydrograph for Lost
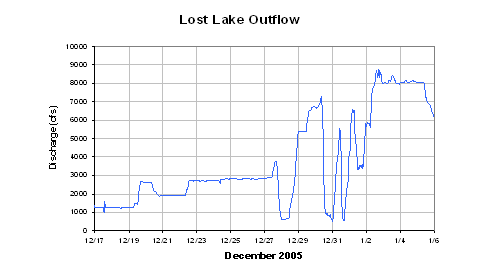
Figure 13. Discharge Hydrograph for Lost
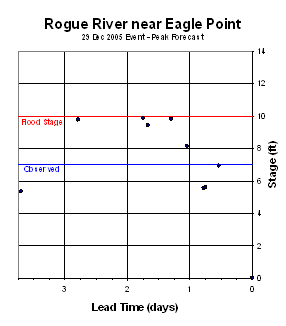
The Corps of Engineers cut back Lost Creek reservoir releases to minimum outflow at the time the Rogue River near Eagle Point (forecast area downstream) was cresting and thus lowered the actual Eagle Point crest and subsequent Rogue River forecast area sites by several feet (Figure 13 and 14.)
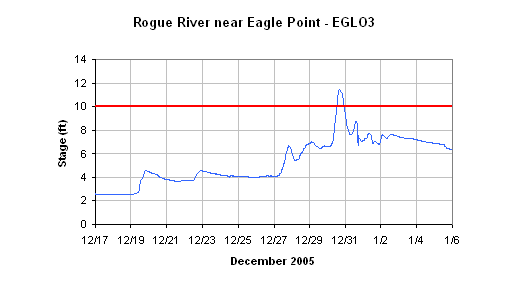
Figure 14. Flood
Hydrograph for the
With Lost Lake Discharges at minimum flow, most of the water
driving the
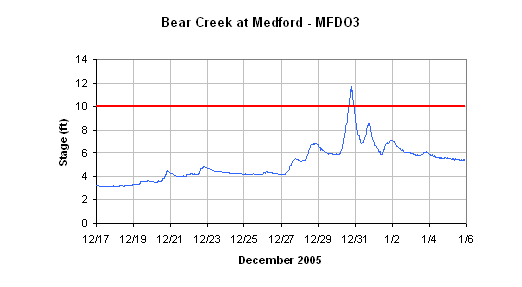
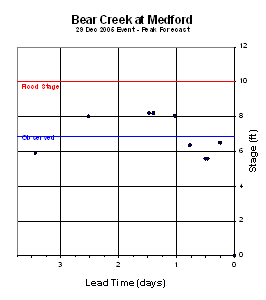
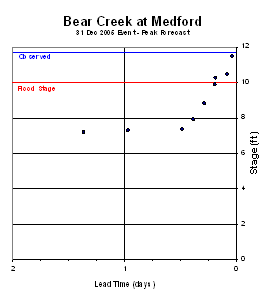
Figure 15. Flood Hydrograph for Bear Creek at
Runoff from the cities of
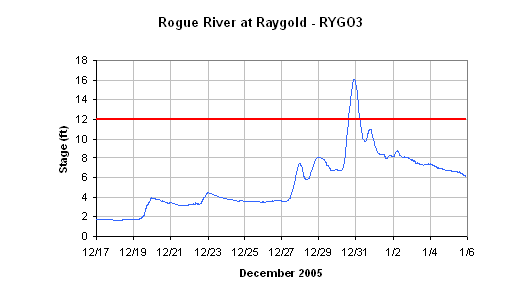
Figure 16. Flood
Hydrograph for the
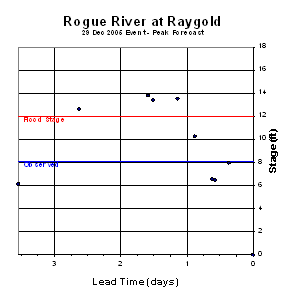
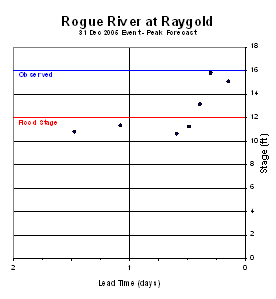
Flood waters from Bear Creek and Eagle Point joined to produce a flood four feet over flood stage at Raygold (Figure 16).
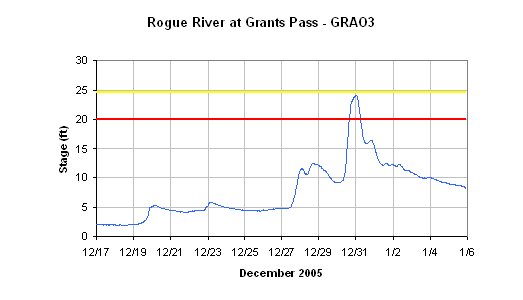
Figure 17. Flood
Hydrograph for the
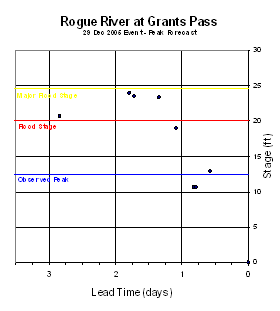
The flood peak at
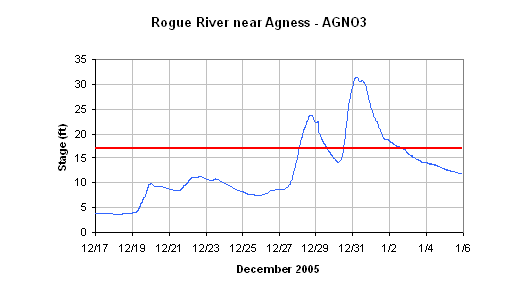
Figure 18. Flood
Hydrograph for the
Rain prior to December 27th brought river stages at
the lower end of the
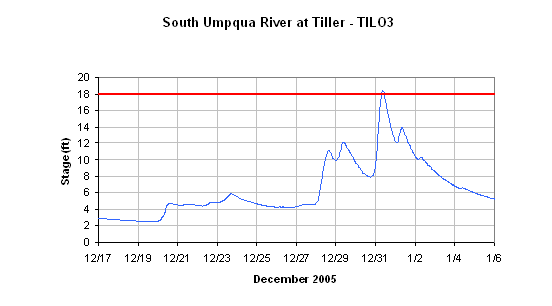
Figure 19. Flood Hydrograph for the
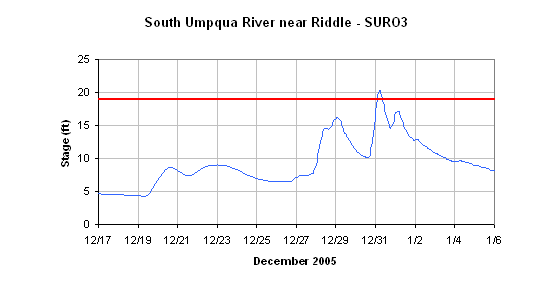
Figure 20. Flood
Hydrograph for the
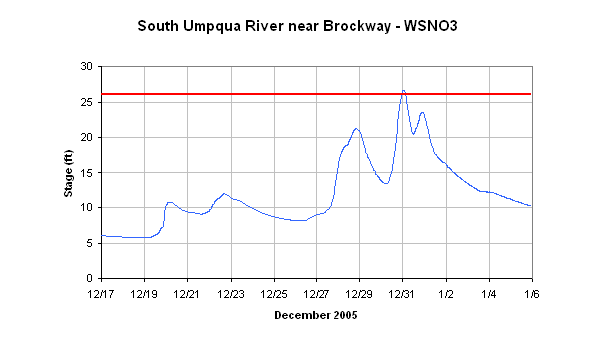
Figure 21. Flood Hydrograph for the
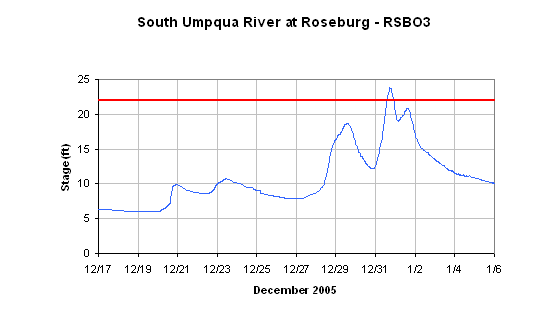
Figure 22. Flood
Hydrograph for the
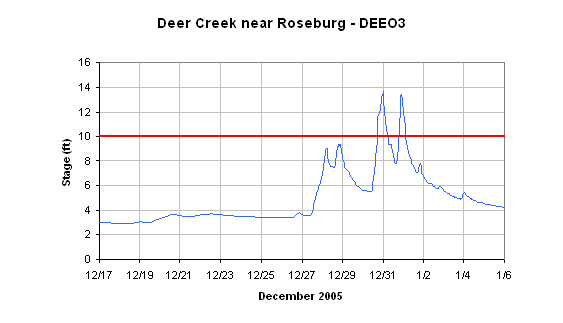
Figure 23. Flood
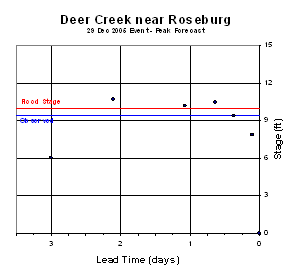
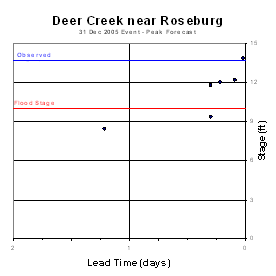
Hydrograph for Deer Creek near
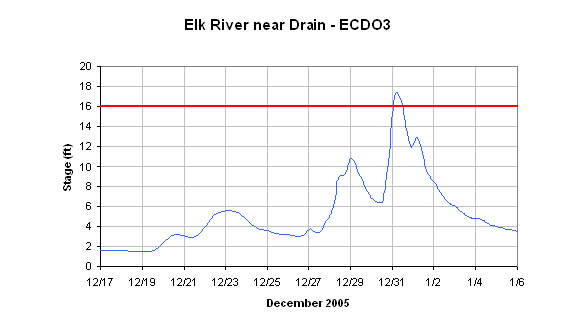
Figure 24. Flood
Hydrograph for the
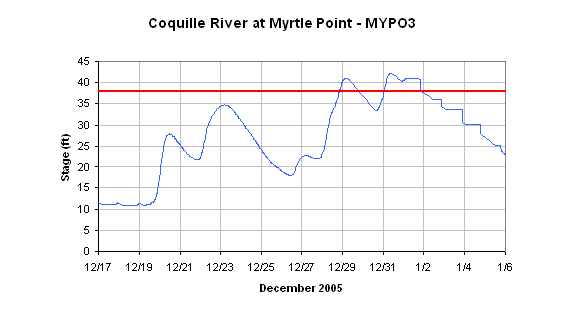
Figure 25. Flood
Hydrograph for the
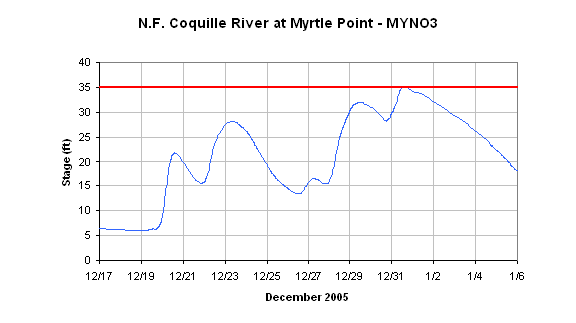
Figure 26. Flood
Hydrograph for the
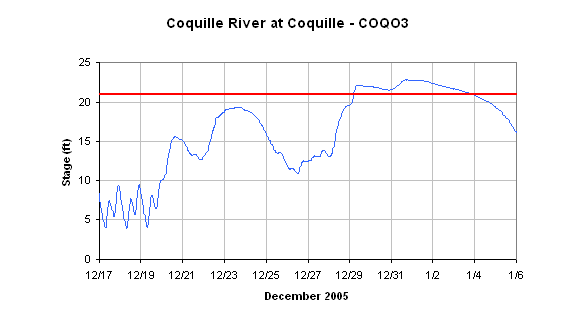
Figure 27. Flood
Hydrograph for the
Forecast Verification
Precipitation Forecasts
The
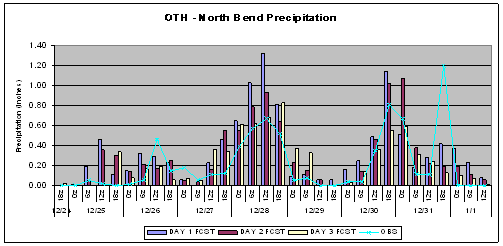
Figure 28. Forecasted and
Observed 6 Hour Cumulative Precipitation for

Figure 29. Forecasted and
Observed 6 Hour Cumulative Precipitation for
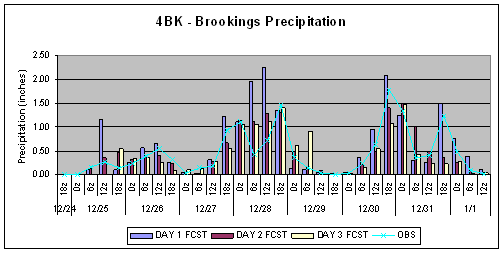
Figure 30. Forecasted and
Observed 6 Hour Cumulative Precipitation for Brooking,
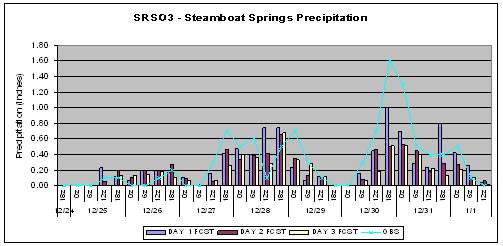
Figure 31. Forecasted and
Observed 6 Hour Cumulative Precipitation for

Figure 32. Forecasted and
Observed 6 Hour Cumulative Precipitation for Riddle,
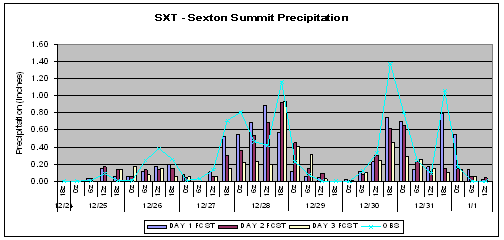
Figure 33. Forecasted and
Observed 6 Hour Cumulative Precipitation for Sexton
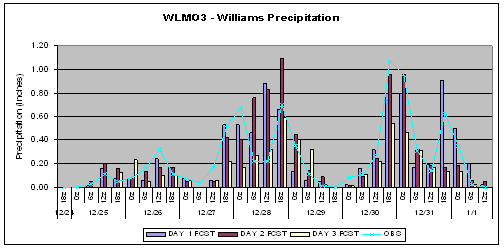
Figure 343. Forecasted and
Observed 6 Hour Cumulative Precipitation for Williams,
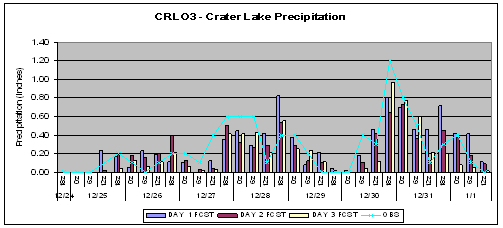
Figure 35. Forecasted and
Observed 6 Hour Cumulative Precipitation for
In general the QPS graphics reveal the portending of three
waves of precipitation. The first
moderate event occurring in and around the 25th, a second heavy
precipitation event confined somewhat to coastal and more mountainous
A closer look at the December 27/28 precipitation event shows a bias toward over forecasting the more coastal QPS sites (North Bend, Illahe, and Brookings) and a good grasp (within a couple tenths of an inch) of the precipitation event two days prior for the inland and more mountainous QPS sites (Steamboat Springs, Riddle, Sexton Mountain, Crater Lake).
The December 30th event in general was within a
half-inch of observed two days in advance for many of the Coastal QPS sites and
December 30th Peak Precipitation (Obs vs.
Fcst)
|
NWS ID |
SITE |
Observed Peak 6hr Precipitation |
Day 1 |
Day 2 Fcst Peak 6hr Precipitation |
Day 3 Fcst Peak 6hr Precipitation |
|
OTH |
|
.81 |
1.14 |
1.07 |
.59 |
|
ILLO3 |
Illahe |
2.70 |
1.37 |
1.58 |
1.27 |
|
4BK |
Brookings |
1.78 |
2.08 |
1.49 |
1.48 |
|
SRSO3 |
Steamboat
Springs |
1.60 |
1.00 |
.53 |
.52 |
|
RDLO3 |
Riddle |
1.30 |
.60 |
.89 |
.39 |
|
SXT |
|
1.06 |
.75 |
.65 |
.45 |
|
CRLO3 |
|
1.20 |
.80 |
.73 |
.97 |
| | Under forecasting
Stream Flow Forecasts
Heavy rains on the December 27th and 30th
were the primary cause for river flooding in
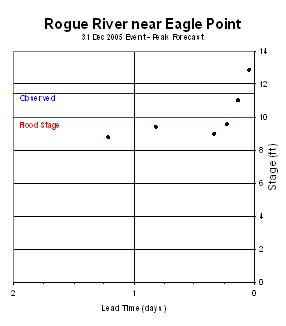
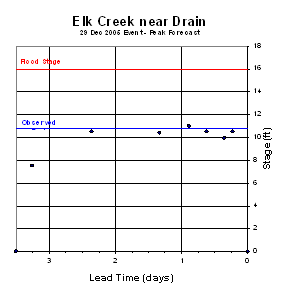
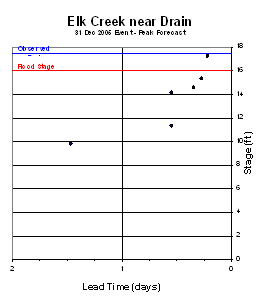
To study flood forecast lead time, flooding is separated into two separate events; one flood event on the 28th (peaking Dec 29th) and a second on the 31st (peaking Jan 01). In the first event the heaviest precipitation was confined to the Southwest Coast and lower reaches of the Rogue, Umpqua, and Coquille river basins. On the 31st of December heavy rains were experienced in all river basin headwaters from the Coast to the upper headwaters of the Cascade draining Rogue and Umpqua (Figures 9 and 10).
NWRFC flood forecast lead time for the December 28th
event is outlined in Table 3 and in Figure 36.
For forecast locations that reached flood stage on December 28th,
lead times were generally greater than 36 hours with the exception of the
smaller Bear Creek drainage near
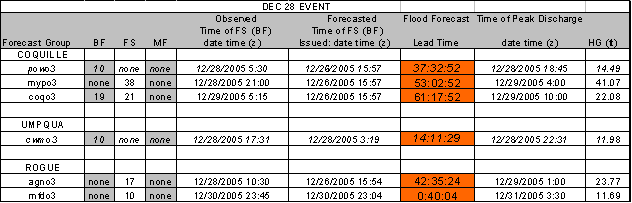
Table 3. Flood Lead Time for December 28th
Event.
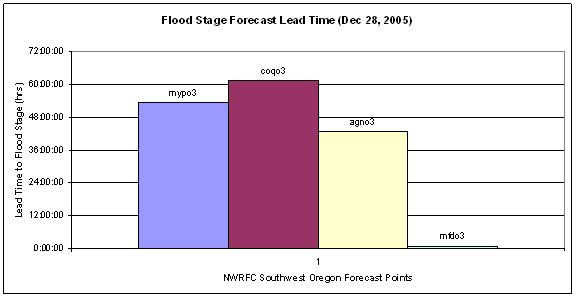
Figure 36. Flood Lead Time for December 28th
Event.
The second flood event followed less than 48 hours after the
first on December 31st.
Forecast lead time is summarized in Table 4 and Figure 37. Long leads from 38 hours to 100 hours are
seen for the lower reaches of the Rogue and
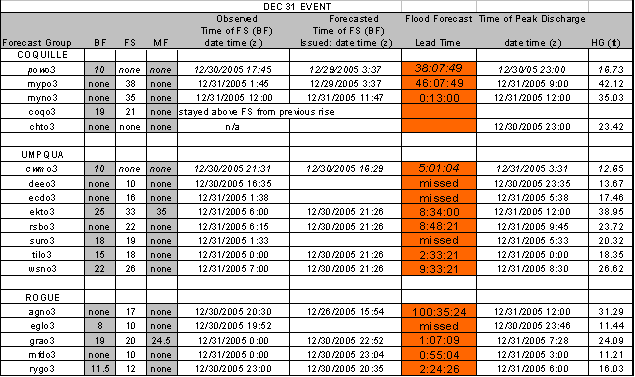
Table 4. Flood Lead Time for December 31st
Event.
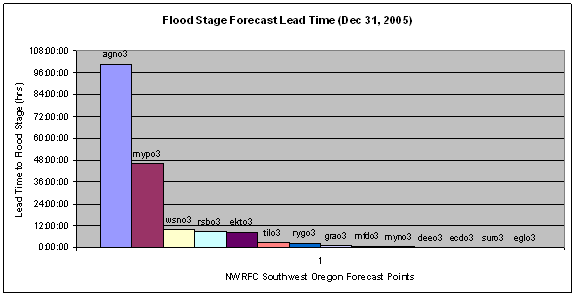
Figure 37. Flood Lead Time for December 31st Event.
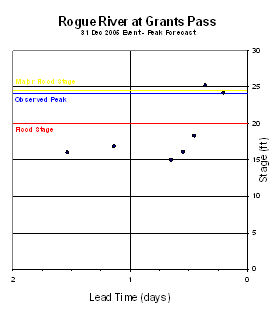
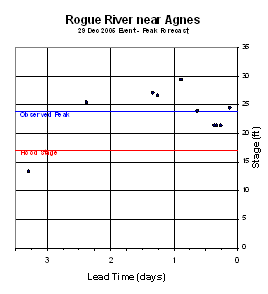
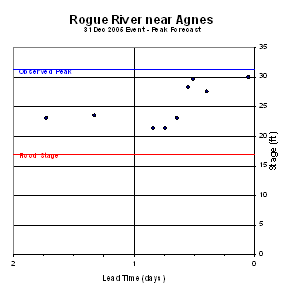
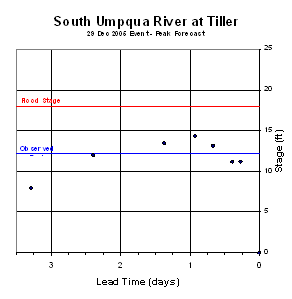
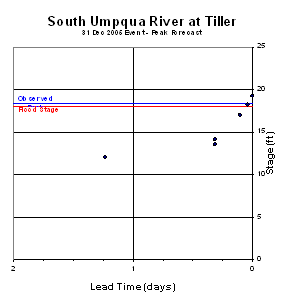
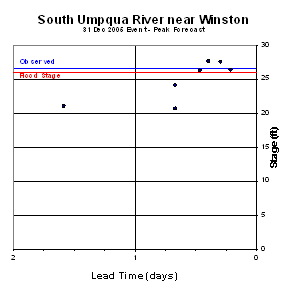
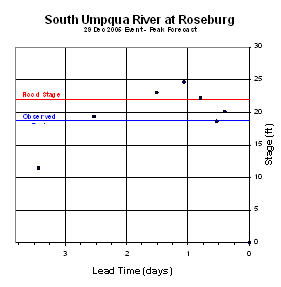
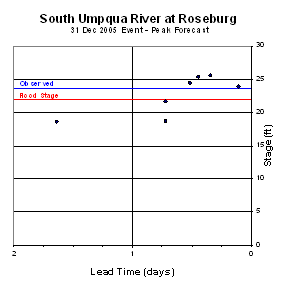
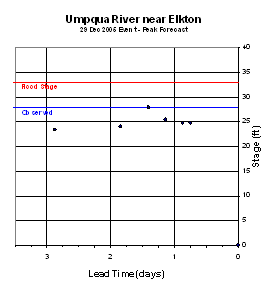
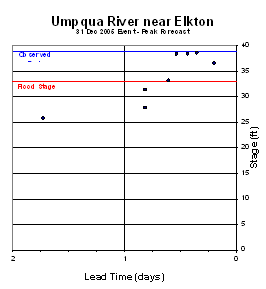
Peak Stage Forecasts
Peak stage forecasts were extracted from NWRFC products and
plotted in reference to time of observed river peak for the events in late
December. Generally, two peaks were
experienced late December (Figures 12 - 26); the first one on December 29th,
the second on December 31st (observed headwater peak for second event). In general flood forecast lead time was
greater for the Coastal and Lower reaches of the Rogue,
Rogue
In reviewing Rogue River peak stage forecasts from NWRFC products, in most cases, flood stage was portended 2.5 days in advance of December 29th peak stage. Minor fluctuations in river forecasts prior to December 29th are coincidental with QPS variances.
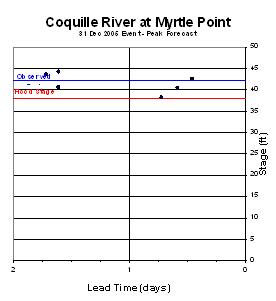
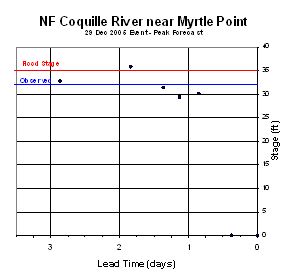
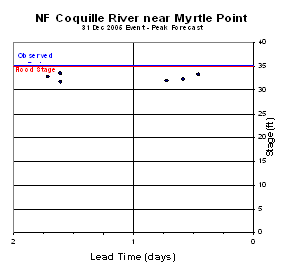
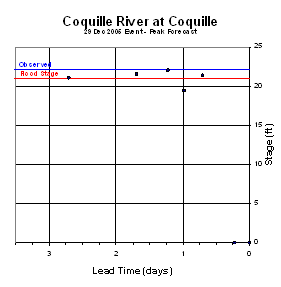
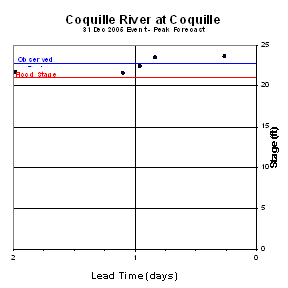
Coquille
Coquille flood forecast lead times for the second event was
less than 12 hours. This is attributed
to the precipitation event stretching into the