DECEMBER
2007 FLOOD EVENT
PART 1: STORM AND ANTECENT WATERSHED
CONDITIONS
A - Storm Meteorological
Summary
Hydrometeorological forecasters at the NWRFC began to see
indications that early December 2007 had
the potential to be warm and very
wet across the Pacific Northwest about one week prior to the event's landfall. This feature was first described in the Hydro-Meteorological
Discussions (HMDs) written on Saturday, November
24, 2007. The key to this initial
outlook was the detection of an unusual upstream
weather pattern in the far
western Pacific. The
remnants of two former Category 2 typhoons (Typhoons Hagibis and Mitag) essentially merged together with the lesser remnants
of two dissipating subtropical depressions (25W and 26W) in the southwestern
Pacific (see figure 1).
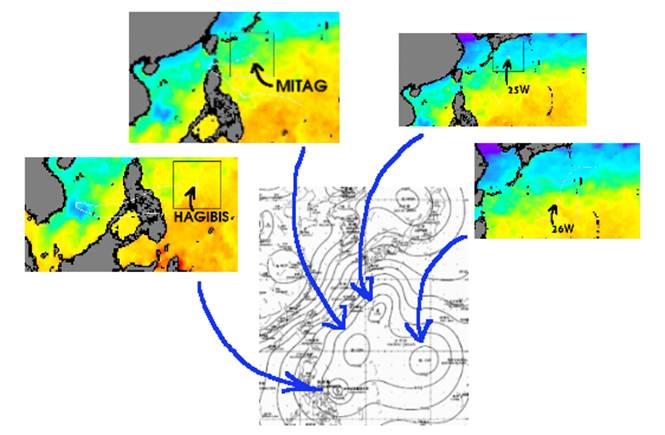
Figure 1 Late November 2007 western Pacific tropical
storm remnants.
The merging subtropical moisture in
these features gradually drifted northward becoming entrained in a progressive
westerly mid-latitude storm track.The left image in Figure 2 shows the source
area of subtropical moisture in the western Pacific on November 26 prior to being entrained
into the jet stream. The
right image shows the entrained moisture plume when it reached the west coast of North America in early December.
Figure 2 Late November to early December focus of
tropical storm remnants.
As this
subtropical moist unstable air approached the west coast of North America, the former tropical storm remnants became
integrated into two rapidly developing and closely linked Eastern Pacific
mid-latitude storms.The first of these two strong storms
shifted heavy rain, quickly increasing freezing levels, warming temperatures,
and very strong low level winds into western Washington and northwest Oregon on Sunday December 2, 2007.Prior impacting the Pacific Northwest, the NWRFC was under the influence of a cold Gulf of Alaska trough pattern.With the cold air in place the first strong storm also produced areas of heavy snow accumulation before
the cold air was scoured out.
Immediately following the first storm the second stronger
storm impacted the coast on Monday
December 3, 2007 bringing even heavier rain, further widespread
freezing level increases, warming temperatures, and extremely strong hurricane
force winds at low levels. In fig. 3,
water vapor imagery depicts progress of the second, more extensive Pacific
storm as it began spreading heavy warm frontal rain across western Washington
shortly after midnight Sunday night.The image also shows the initial Pacific
storm dissipating across central Montana.Ten hours later, visible satellite imagery
(fig. 4) showed the first storm moving through eastern Montana,
while second storm was pounding recently saturated Western
Washington and Northwestern Oregon basins
with even more heavy rain.The warm
southwesterly advection continued raising freezing levels, which were well
above most summits of the Coast Range,
Olympics, and Cascades at this time.
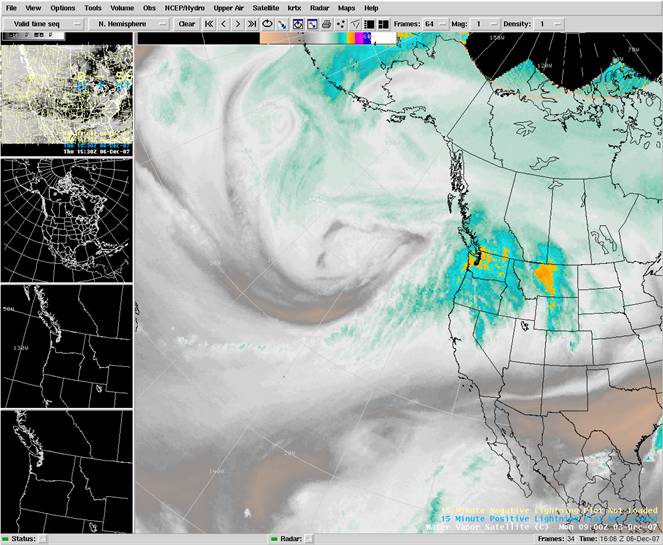
Figure 3 December 3, 2007 water vapor imagery.
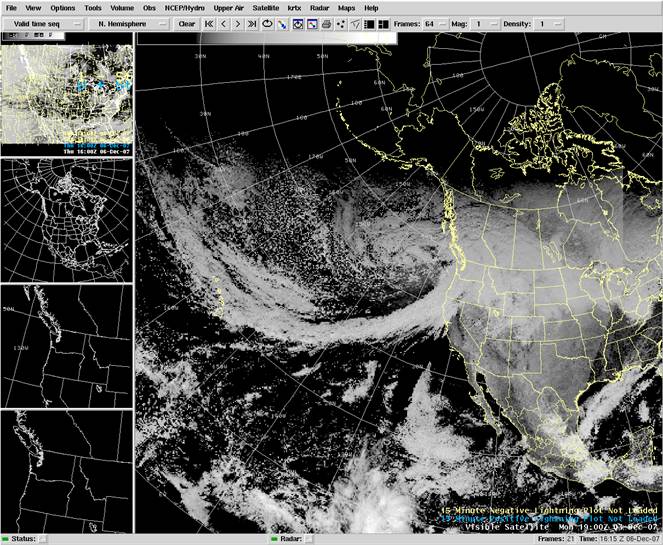
Figure 4 December
3, 2007 1900Z visible satellite imagery.
B - Antecedent Conditions
The water content of the snow pack and soil
moisture content prior are two major hydrological factors that affect how a
watershed will respond to precipitation events. Both of these factors indicate that watershed
initial conditions were to the drier side of normal prior to the storm.This reinforces
the belief that storm characteristics were the primary factors driving the
flood response.
Snow pack
Prior to the warm and wet severe weather impacting the Pacific
Northwest, the region was under the influence of a cold Gulf
of Alaska trough pattern.
Between Wednesday November 28 and Saturday December 1, 2007 temperatures fell below
normal, causing precipitation to fall as snow below 1000 feet.An additional 1 to 2 inches of snow water
equivalent (SWE) accumulated at elevations above 2000 feet across western Washington
and northwest Oregon.This minor accumulation of snow added little
to existing snow pack that was measuring between 50 and 60 percent of normal at
NRCS SNOTEL. These sites also indicated that there was some snow accumulation
down to an elevation of 3000 feet.The
NOHRSC also modeled relatively light snow water equivalent (SWE) prior to the
storm, especially in lower elevation areas west of the Cascades (see figure 5).
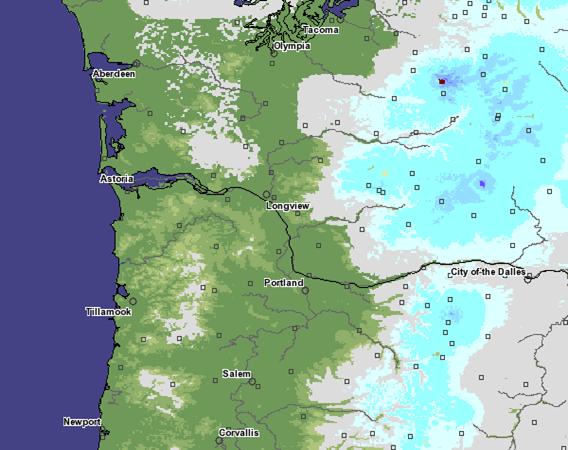
Figure 5 NOHRSC modeled snow water equivalent for December 2, 2007
Figure 6 illustrates
the very cold, Arctic-like thermal characteristics of low level air in place
east of the Cascades just before the event.
With the cold air in place precipitation during the first storm began
falling as snow on Sunday December 2nd and accumulated at elevations as low as
2000 feet in the northern Oregon Coastal Range and western Washington by the morning of December 3rd
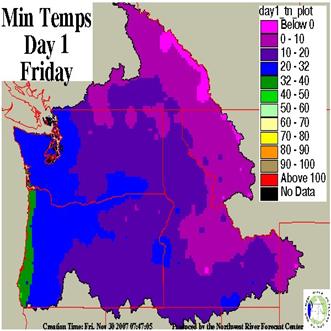
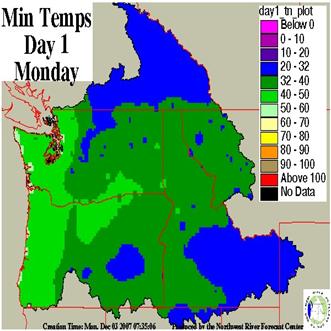
Figure 6 November
30,2007 minimum temperatureFigure 7December 3,2007 minimum temperature forecast. forecast.
The areal extent
and depth of this transient snow pack is difficult to determine because few
measurement sites were available and the rapid ablation.There were
several SNOTEL sites that showed the magnitude of newly accumulated snow in Coast Range and Cascade Mountains.For example, figure 8 shows 9 inch increase in the SWE measured at the Saddle
Mountain SNOTEL
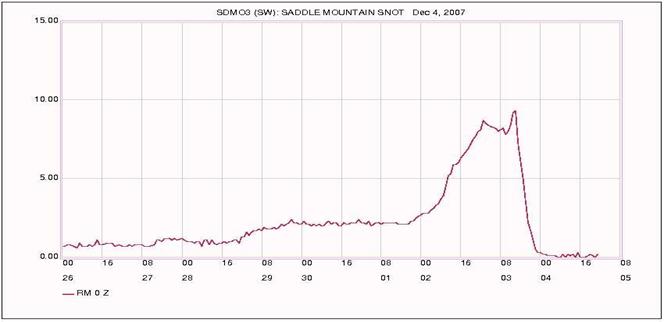
Figure 8 Saddle
Mountain SNOTEL snow water
equivalent measurements.
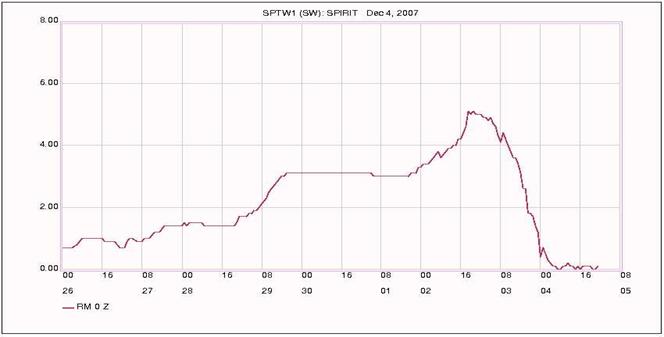
Figure 9 Spirit Lake
SNOTEL snow water equivalent measurements.
(SDMO3) site
which is at an elevation of 3110 feet in the Oregon Coast Range.A similar but less dramatic accumulation was
observed at the Spirit Lake SNOTEL site which is located at 3120 feet in
the Cascade Mountains of southwest Washington (see figure 9).Even
the Seine Creek SNOTEL site,
which is located an elevation of 2060 feet, showed an SWE increase of
1.5 inches. By Monday the Arctic-like air was scoured
out of the region by the warm-core storm (see figure 7) and the rain/snow elevation rose above
6000 feet.Temperatures were 12 to 18
degrees above the normal daily maximum temperatures and actual maximum
temperatures at the Saddle Mountain site on 12/03/07 was 50
degrees.The heavy rainfall, high winds
and warming air caused the snow pack below 3500 feet to
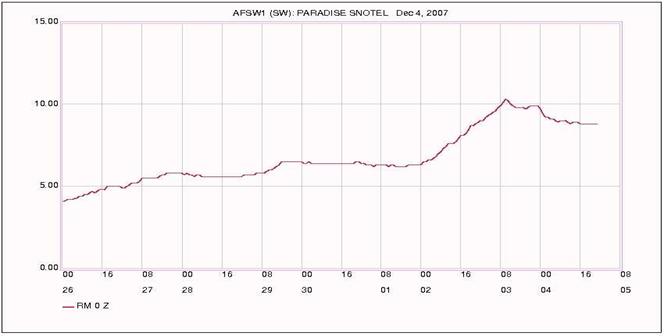
Figure 10SNOTEL snow water equivalent measurements.
ripened and then rapidly melt in it entirety.The Saddle Mountain data showed that the
entire 9 inches of accumulated SWE was released between 1400Z and 2200Z on
Monday, coinciding with the tail end of high intensity rainfall at Lee's
Camp.With increasing elevation a higher
percentageof the precipitation either fell as snow or was
absorbed by the existing snow pack.
The plot of SWE measured at the Paradise SNOTEL site (see figure 10), which is located at
an elevation of 5130 feet in the Washington Cascades, is typical of sites above
3500 feet which show a net increase in SWE.
NWSRFS Snow Updating
On November 30,
2007 the Friday prior to the December 3rd flood event,
observed snow conditions were used to verify the NWS hydrologic river model
(NWSRFS) snow states.On that day low
elevation SNOTEL sites west of the Cascades
Mountains (between 3000' and 3500')
generally ranged from 60 to100% of normal.
The lowest elevation sites, which had a relatively low average for this
time of year, tended to have SWE values that were
greater than normal. The SWE at these
sites resulted from an accumulation during the recent cold outbreak.The highest observations were seen at Spirit
Lake at 3120 feet in the Cowlitz River Basin was at 3.1 inches (182% of normal)
and Saddle Mountain at 3110 feet in the northern Oregon Coast Range which was
2.0 inches (133% of normal).Model snow
states of the lower elevation basins were found to be with the range shown by
the observations.
Higher elevation SNOTEL sites (between 5000' and 6000') averaged
near 60% of normal in the central western Washington Cascades falling to 40% of
normal in the southern Oregon.Comparision of the
SNOTEL observations with NWSRFS model states indicated that simulated snow
water equivalent increases were needed to the upper zones of the Snoqualamie River
north to the Nooksack
Basin and basin draining the
northern Oregon Cascades. Snow water
equivalent decreases also were made to upper zone basins in the Willamette
Basin.The updated NWSRFS SWE amounts were used in November 30, 2007 river forecasts
(Table 1).
Table 1 NWSRFS snow water equivalent
adjustments made on November 30,2007.
|
Location
|
Zone
|
Elevation
feet
|
Increase SWE
inches
|
Decrease SWE
inches
|
|
Ross Reservoir Near Newhalem
|
RODW1IU
|
7400-8300
|
1.2
|
|
|
Skagit
River
at Newhalem
|
GORW1X
|
1100-7400
|
1.1
|
|
|
Sauk
River
near Sauk
|
SAKW1M
|
4400-7000
|
.6
|
|
|
Upper Baker Dam
|
UBKW1IU
|
5000-7000
|
2.4
|
|
|
Lake
Shannon
|
SHDW1XU
|
5000-8000
|
2.1
|
|
|
Skykomish
River
Near Gold Bar
|
GLBW1U
|
3500-6190
|
1.4
|
|
|
Snoqualamie
River
Near Carnation
|
CRNW1XU
|
3000-5873
|
1.0
|
|
|
Cowlitz
River
near Packwood
|
PACW1U
|
4400-5800
|
.7
|
|
|
Cowlitz
River
at Randle
|
RAWW1XU
|
3500-6870
|
|
.6
|
|
Green Peter Dam
|
GPRO3IU
|
3500-5128
|
|
1.1
|
|
Detroit
Dam
|
DETO3IU
|
5200-10487
|
6.3
|
|
|
Detroit
Dam
|
DETO3IM
|
3200-5200
|
|
1.3
|
|
Hills Creek Dam
|
HCRO3IU
|
5500-8120
|
1.6
|
|
|
Fall Creek Reservoir
|
FALO3IU
|
3500-5214
|
|
1.8
|
|
Dorena
Dam
|
DORO3IU
|
3800-5933
|
|
.6
|
|
Cougar Dam
|
CGRO3IU
|
3500-6300
|
|
.6
|
Soil Moisture Content
A direct measure of basin soil moisture was
not available, but it can
be inferred from an evaluation of precipitation that has accumulated since the
beginning of the water year and stream flow levels
prior to the storm.
Figure 11 shows that the amount of precipitation
received in northwest Oregon and western Washington during the month of November was 50 to 70 percent of normal. The drier than normal
November offset the above normal precipitation that occurred earlier in the
water year. The cumulative seasonal
precipitation plot shown in figure 12 shows that the areas affected by early
December flooding had accumulated near normal amounts prior to the event.
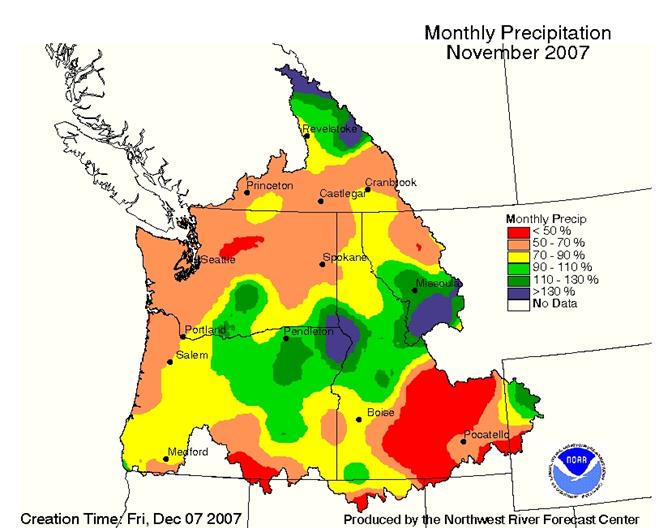
Figure 11 November cumulative monthly
precipitation.
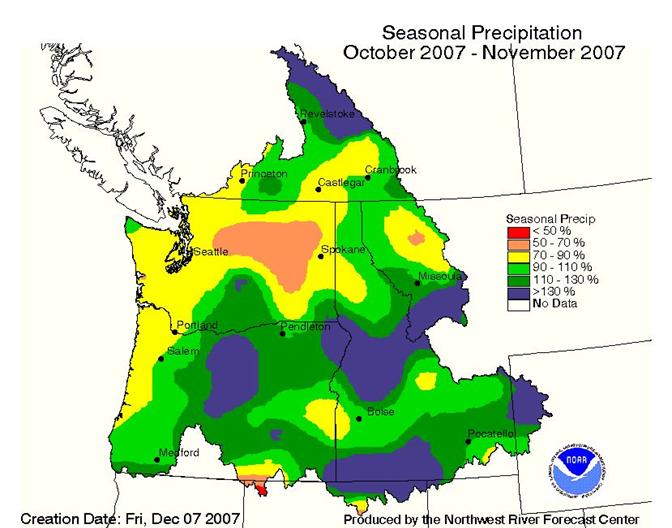
Figure 12 Seasonal
cumulative monthly precipitation.
Stream flow hydrographs also showed that
the soils were relatively drained prior to the storm event.The relatively flat hydrograph for the Nehalem River at Foss, Oregon (figure 13) was typical of rivers west of the Cascade Mountains prior
to the event.The hydrograph shows that
flow was primarily driven by baseflow.Only two minor rises were visible in the week
preceding the event.Flow in the river
on November
30, 2007 was around 2500 cfs,
well below the mean flow of 5300 cfs.
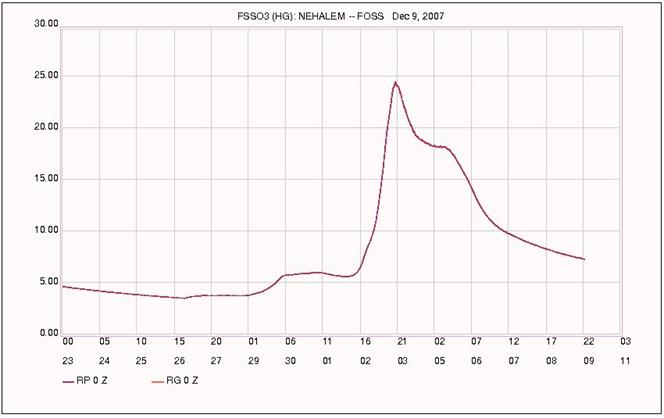
Figure 13 Hydrograph of the Nehalem
River at Foss, Oregon.