DECEMBER
2007 FLOOD EVENT
PART 2: FORECAST VERIFICATION
December 2007 Event Verification
The verification discussion is divided into
two sections.In the first section the
primary meteorological input, quantitative precipitation forecast (QPF), is
evaluated.Evaluation of the hydrologic
forecasts follows.
Meteorological Verification
This was the first major event where hydrometeorologists at the NWRFC utilized GFE to generate
forecasted mean areal precipitation (FMAP) for input
to hydrologic models.Hydrometeorolgical forecasters started using GFE generated
QPF operationally this season.Each
morning the HAS forecaster initializes NWRFC's QPF
field using a mix of WFO ISC, HPC, and various model (GFS and
Presentation of QPF verification will start
off with spatial products generated during the event.This will be followed by basin specific
analysis of point forecasts.Figure 1 displays
the 24 hour QPF field in GFE for day 1.
The derived calibration point precipitation values for that same 24 hour
period are shown in figure 2.These can
be compared with the image of observed precipitation displayed on the
verification web page (see figure 3).
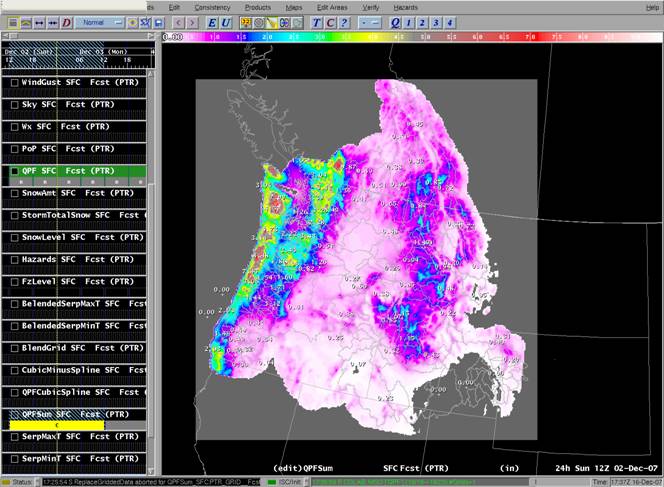
Figure 1 NWRFC GFE display ofday 1 QPF from
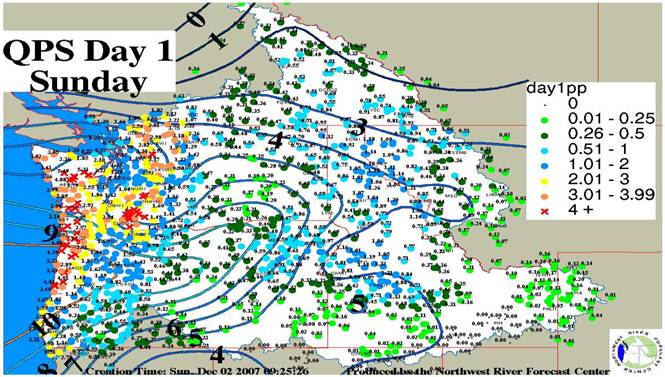
Figure 2 NWRFC point QPF plot for day 1 plot from
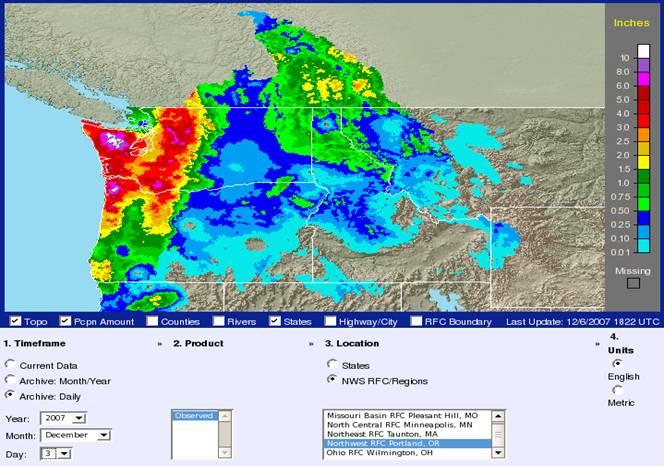
Figure 3 Observed cumulative precipitation from
In fig. 1 there is a 7.45 inch 24 hour
day-1 forecast accumulation sample value in the north
The day 2 GFE QPF grid shown in figure 4
showed that less precipitation was forecasted for Monday. The point QPF product
displayed in figure 5 shows that the day 1 GFE QPF grid generated Monday
morning (not shown) was an improvement over the forecast two days out.
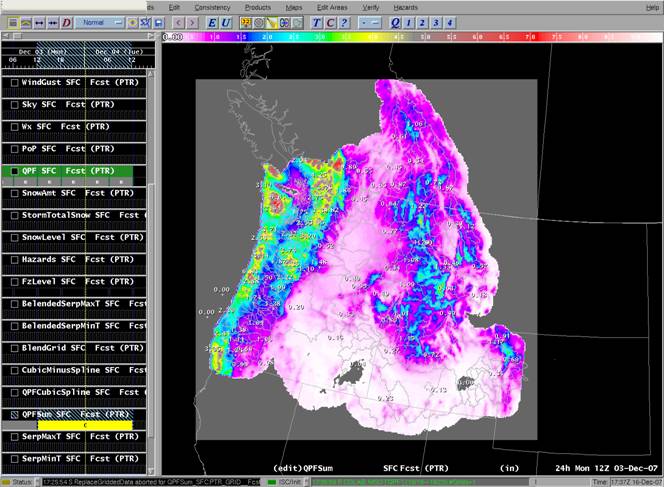
Figure 4 NWRFC GFE display of day 2 QPF from
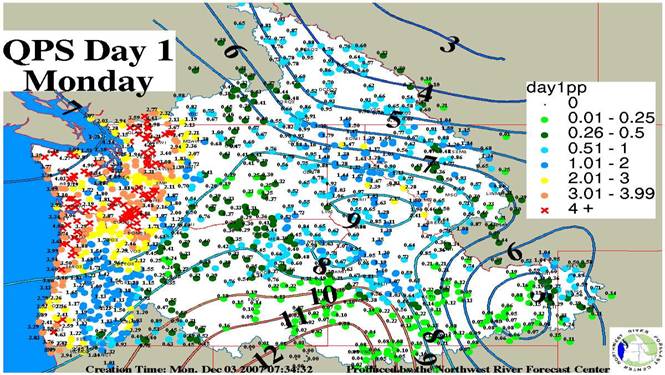
Figure 5NWRFC
point QPF plot for day 1 plot from
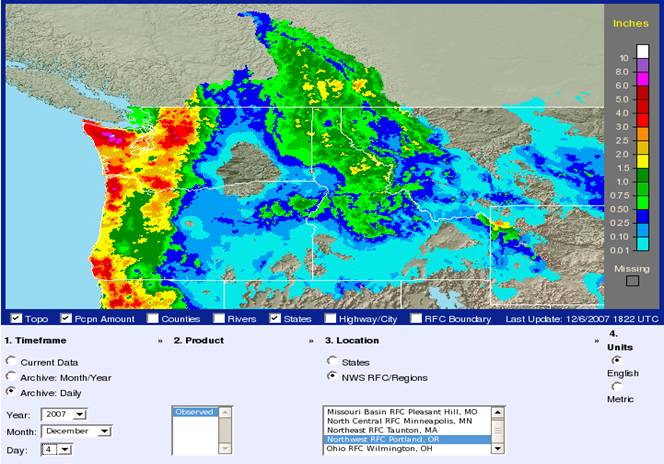
Figure 6Observed
cumulative precipitation from
Figures 7 and 8 Comparison of Precipitation Forecasts for
the
Figures 9 and 10Scatter Diagrams
of Observed Precipitationand NWRFC QPF
for the
|
|
||||||||||
|
Event Performance Statistics |
||||||||||
|
Event Performance -
MAJOR EVENTS |
|
|
Event Performance -
MAJOR EVENTS |
|||||||
|
1.00"+ in
6-hour Time Period |
|
|
4.00"+ in
24-hour Time Period |
|||||||
|
|
NWRFC |
HPC |
PQR |
|
|
|
NWRFC |
HPC |
PQR |
|
|
POD |
0.47 |
0.77 |
0.30 |
|
|
POD |
0.50 |
0.83 |
0.00 |
|
|
FAR |
0.18 |
0.08 |
0.10 |
|
|
FAR |
0.40 |
0.00 |
1.00 |
|
|
CSI |
0.42 |
0.72 |
0.29 |
|
|
CSI |
0.38 |
0.83 |
0.00 |
|
|
|
|
|
|
|
|
|
|
|
|
|
|
Event Performance -
MODERATE EVENTS |
|
|
Event Performance -
MODERATE EVENTS |
|||||||
|
0.50"+ in 6-hour Time Period |
|
|
2.00"+ in 24-hour Time Period |
|||||||
|
|
NWRFC |
HPC |
PQR |
|
|
|
NWRFC |
HPC |
PQR |
|
|
POD |
0.90 |
0.93 |
0.71 |
|
|
POD |
1.00 |
0.92 |
0.75 |
|
|
FAR |
0.12 |
0.11 |
0.03 |
|
|
FAR |
0.00 |
0.00 |
0.00 |
|
|
CSI |
0.81 |
0.83 |
0.70 |
|
|
CSI |
1.00 |
0.92 |
0.75 |
|
|
|
|
|
|
|
|
|
|
|
|
|
|
Event Performance -
MINOR EVENTS |
|
|
Event Performance -
MINOR EVENTS |
|||||||
|
0.25"+ in 6-hour Time Period |
|
|
1.00"+ in 24-hour Time Period |
|||||||
|
|
NWRFC |
HPC |
PQR |
|
|
|
NWRFC |
HPC |
PQR |
|
|
POD |
0.89 |
0.93 |
0.88 |
|
|
POD |
0.89 |
0.89 |
0.78 |
|
|
FAR |
0.09 |
0.07 |
0.09 |
|
|
FAR |
0.00 |
0.00 |
0.00 |
|
|
CSI |
0.82 |
0.87 |
0.81 |
|
|
CSI |
0.89 |
0.89 |
0.78 |
|
Table 1 Event QPF Verification
Statistics for the
|
|
||||||||||
|
Daily Forecast Performance Statistics |
||||||||||
|
Forecast Bias (Mean
Algebraic Error) |
|
|
Forecast Bias (Mean
Algebraic Error) |
|||||||
|
6-hour Time Period, All Stations |
|
|
24-hour Time Period, All Stations |
|||||||
|
|
NWRFC |
HPC |
PQR |
|
|
|
NWRFC |
HPC |
PQR |
|
|
Day
1 Fcst |
-0.078 |
-0.260 |
-0.236 |
|
|
Day
1 Fcst |
-0.313 |
-1.038 |
-0.943 |
|
|
Day
2 Fcst |
-0.324 |
-0.188 |
-0.476 |
|
|
Day
2 Fcst |
-1.295 |
-0.750 |
-1.903 |
|
|
Day
3 Fcst |
-0.508 |
-0.308 |
-0.610 |
|
|
Day
3 Fcst |
-2.030 |
-1.232 |
-2.440 |
|
|
|
|
|
|
|
|
|
|
|
|
|
|
All Periods |
-0.303 |
-0.252 |
-0.441 |
|
|
All Periods |
-1.213 |
-1.007 |
-1.762 |
|
|
|
|
|
|
|
|
|
|
|
|
|
|
Forecast RMS Error |
|
|
Forecast RMS Error |
|||||||
|
6-hour Time Period, All Stations |
|
|
24-hour Time Period, All Stations |
|||||||
|
|
NWRFC |
HPC |
PQR |
|
|
|
NWRFC |
HPC |
PQR |
|
|
Day
1 Fcst |
0.682 |
0.646 |
0.765 |
|
|
Day
1 Fcst |
1.903 |
1.455 |
2.397 |
|
|
Day
2 Fcst |
0.858 |
0.582 |
0.967 |
|
|
Day
2 Fcst |
1.984 |
1.229 |
2.409 |
|
|
Day
3 Fcst |
0.979 |
2.604 |
1.091 |
|
|
Day
3 Fcst |
2.835 |
1.745 |
3.145 |
|
|
|
|
|
|
|
|
|
|
|
|
|
|
All Periods |
0.848 |
1.585 |
0.950 |
|
|
All Periods |
2.280 |
1.491 |
2.673 |
|
|
|
|
|
|
|
|
|
|
|
|
|
|
Forecast Error (Mean
Absolute Error) |
|
|
Forecast Error (Mean
Absolute Error) |
|||||||
|
6-hour Time Period, All Stations |
|
|
24-hour Time Period, All Stations |
|||||||
|
|
NWRFC |
HPC |
PQR |
|
|
|
NWRFC |
HPC |
PQR |
|
|
Day
1 Fcst |
0.405 |
0.310 |
0.452 |
|
|
Day
1 Fcst |
1.367 |
1.075 |
1.633 |
|
|
Day
2 Fcst |
0.592 |
0.352 |
0.581 |
|
|
Day
2 Fcst |
1.295 |
0.790 |
1.903 |
|
|
Day
3 Fcst |
0.617 |
0.478 |
0.695 |
|
|
Day
3 Fcst |
2.030 |
1.232 |
2.440 |
|
|
|
|
|
|
|
|
|
|
|
|
|
|
All Periods |
0.538 |
0.380 |
0.576 |
|
|
All Periods |
1.564 |
1.032 |
1.992 |
|
Table 2 Daily QPF Verification
Statistics for the
Figures 11 and 12Comparison of Precipitation Forecasts
for
Figures 13 and 14Comparison of Precipitation Forecasts
for Lees Camp,
Figures 15 and 16Comparison of Precipitation Forecasts
for the

Figures 17 and 18 Scatter
Diagrams of Observed Precipitation and NWRFC QPF for the
|
|
||||||||||
|
Event Performance Statistics |
||||||||||
|
Event Performance -
MAJOR EVENTS |
|
|
Event Performance -
MAJOR EVENTS |
|||||||
|
1.00"+ in
6-hour Time Period |
|
|
4.00"+ in
24-hour Time Period |
|||||||
|
|
NWRFC |
HPC |
PQR |
|
|
|
NWRFC |
HPC |
PQR |
|
|
POD |
0.38 |
0.57 |
0.26 |
|
|
POD |
0.33 |
0.42 |
0.00 |
|
|
FAR |
0.16 |
0.08 |
0.08 |
|
|
FAR |
0.33 |
0.00 |
1.00 |
|
|
CSI |
0.36 |
0.55 |
0.26 |
|
|
CSI |
0.29 |
0.42 |
0.00 |
|
|
|
|
|
|
|
|
|
|
|
|
|
|
Event Performance -
MODERATE EVENTS |
|
|
Event Performance -
MODERATE EVENTS |
|||||||
|
0.50"+ in 6-hour Time Period |
|
|
2.00"+ in 24-hour Time Period |
|||||||
|
|
NWRFC |
HPC |
PQR |
|
|
|
NWRFC |
HPC |
PQR |
|
|
POD |
0.92 |
0.93 |
0.68 |
|
|
POD |
0.94 |
0.89 |
0.67 |
|
|
FAR |
0.10 |
0.08 |
0.02 |
|
|
FAR |
0.00 |
0.00 |
0.00 |
|
|
CSI |
0.83 |
0.86 |
0.67 |
|
|
CSI |
0.94 |
0.89 |
0.67 |
|
|
|
|
|
|
|
|
|
|
|
|
|
|
Event Performance -
MINOR EVENTS |
|
|
Event Performance -
MINOR EVENTS |
|||||||
|
0.25"+ in 6-hour Time Period |
|
|
1.00"+ in 24-hour Time Period |
|||||||
|
|
NWRFC |
HPC |
PQR |
|
|
|
NWRFC |
HPC |
PQR |
|
|
POD |
0.90 |
0.92 |
0.89 |
|
|
POD |
0.92 |
0.92 |
0.83 |
|
|
FAR |
0.08 |
0.07 |
0.07 |
|
|
FAR |
0.00 |
0.00 |
0.00 |
|
|
CSI |
0.84 |
0.86 |
0.83 |
|
|
CSI |
0.92 |
0.92 |
0.83 |
|
Table 3 Event QPF Verification
Statistics for the
|
|
||||||||||
|
Daily Forecast Performance Statistics |
||||||||||
|
Forecast Bias (Mean
Algebraic Error) |
|
|
Forecast Bias (Mean
Algebraic Error) |
|||||||
|
6-hour Time Period, All Stations |
|
|
24-hour Time Period, All Stations |
|||||||
|
|
NWRFC |
HPC |
PQR |
|
|
|
NWRFC |
HPC |
PQR |
|
|
Day
1 Fcst |
-0.112 |
-0.289 |
-0.242 |
|
|
Day
1 Fcst |
-0.448 |
-1.157 |
-0.968 |
|
|
Day
2 Fcst |
-0.321 |
-0.236 |
-0.454 |
|
|
Day
2 Fcst |
-1.283 |
-0.944 |
-1.816 |
|
|
Day
3 Fcst |
-0.475 |
-0.327 |
-0.569 |
|
|
Day
3 Fcst |
-1.900 |
-1.308 |
-2.278 |
|
|
|
|
|
|
|
|
|
|
|
|
|
|
All Periods |
-0.303 |
-0.284 |
-0.422 |
|
|
All Periods |
-1.210 |
-1.136 |
-1.687 |
|
|
|
|
|
|
|
|
|
|
|
|
|
|
Forecast RMS Error |
|
|
Forecast RMS Error |
|||||||
|
6-hour Time Period, All Stations |
|
|
24-hour Time Period, All Stations |
|||||||
|
|
NWRFC |
HPC |
PQR |
|
|
|
NWRFC |
HPC |
PQR |
|
|
Day
1 Fcst |
0.610 |
0.600 |
0.687 |
|
|
Day
1 Fcst |
1.724 |
1.563 |
2.174 |
|
|
Day
2 Fcst |
0.779 |
0.588 |
0.860 |
|
|
Day
2 Fcst |
1.846 |
1.381 |
2.267 |
|
|
Day
3 Fcst |
0.907 |
0.686 |
1.016 |
|
|
Day
3 Fcst |
2.587 |
1.716 |
2.902 |
|
|
|
|
|
|
|
|
|
|
|
|
|
|
All Periods |
0.775 |
0.626 |
0.865 |
|
|
All Periods |
2.088 |
1.559 |
2.469 |
|
|
|
|
|
|
|
|
|
|
|
|
|
|
Forecast Error (Mean
Absolute Error) |
|
|
Forecast Error (Mean
Absolute Error) |
|||||||
|
6-hour Time Period, All Stations |
|
|
24-hour Time Period, All Stations |
|||||||
|
|
NWRFC |
HPC |
PQR |
|
|
|
NWRFC |
HPC |
PQR |
|
|
Day
1 Fcst |
0.354 |
0.326 |
0.404 |
|
|
Day
1 Fcst |
1.177 |
1.181 |
1.457 |
|
|
Day
2 Fcst |
0.524 |
0.365 |
0.537 |
|
|
Day
2 Fcst |
1.283 |
0.971 |
1.816 |
|
|
Day
3 Fcst |
0.566 |
0.454 |
0.645 |
|
|
Day
3 Fcst |
1.900 |
1.308 |
2.278 |
|
|
|
|
|
|
|
|
|
|
|
|
|
|
All Periods |
0.481 |
0.382 |
0.529 |
|
|
All Periods |
1.453 |
1.153 |
1.850 |
|
Table 4 Daily QPF Verification
Statistics for the
Figures 19 and 20 Comparison of Precipitation Forecasts for
Lees Camp,
Figures 21 and 22 Comparison of Precipitation Forecasts for
Figures 23 and 24Comparison of Precipitation Forecasts
for the
Figures 24 and 25 Scatter Diagrams
of Observed Precipitation and NWRFC QPF for the
|
|
||||||||||
|
Event Performance Statistics |
||||||||||
|
Event Performance -
MAJOR EVENTS |
|
|
Event Performance -
MAJOR EVENTS |
|||||||
|
1.00"+ in
6-hour Time Period |
|
|
4.00"+ in
24-hour Time Period |
|||||||
|
|
NWRFC |
HPC |
SEW |
|
|
|
NWRFC |
HPC |
SEW |
|
|
POD |
0.38 |
0.39 |
0.56 |
|
|
POD |
0.46 |
0.38 |
0.56 |
|
|
FAR |
0.34 |
0.18 |
0.32 |
|
|
FAR |
0.27 |
0.00 |
0.29 |
|
|
CSI |
0.32 |
0.36 |
0.44 |
|
|
CSI |
0.39 |
0.38 |
0.45 |
|
|
|
|
|
|
|
|
|
|
|
|
|
|
Event Performance -
MODERATE EVENTS |
|
|
Event Performance -
MODERATE EVENTS |
|||||||
|
0.50"+ in 6-hour Time Period |
|
|
2.00"+ in 24-hour Time Period |
|||||||
|
|
NWRFC |
HPC |
SEW |
|
|
|
NWRFC |
HPC |
SEW |
|
|
POD |
0.72 |
0.89 |
0.93 |
|
|
POD |
0.59 |
0.86 |
1.00 |
|
|
FAR |
0.25 |
0.25 |
0.22 |
|
|
FAR |
0.14 |
0.11 |
0.33 |
|
|
CSI |
0.58 |
0.69 |
0.74 |
|
|
CSI |
0.54 |
0.77 |
0.67 |
|
|
|
|
|
|
|
|
|
|
|
|
|
|
Event Performance -
MINOR EVENTS |
|
|
Event Performance -
MINOR EVENTS |
|||||||
|
0.25"+ in 6-hour Time Period |
|
|
1.00"+ in 24-hour Time Period |
|||||||
|
|
NWRFC |
HPC |
SEW |
|
|
|
NWRFC |
HPC |
SEW |
|
|
POD |
0.83 |
0.86 |
0.95 |
|
|
POD |
0.97 |
0.96 |
1.00 |
|
|
FAR |
0.15 |
0.14 |
0.15 |
|
|
FAR |
0.01 |
0.03 |
0.05 |
|
|
CSI |
0.72 |
0.75 |
0.81 |
|
|
CSI |
0.96 |
0.94 |
0.95 |
|
Table 5 Event QPF Verification
Statistics for the
|
|
||||||||||
|
Daily Forecast Performance Statistics |
||||||||||
|
Forecast Bias (Mean
Algebraic Error) |
|
|
Forecast Bias (Mean
Algebraic Error) |
|||||||
|
6-hour Time Period, All Stations |
|
|
24-hour Time Period, All Stations |
|||||||
|
|
NWRFC |
HPC |
SEW |
|
|
|
NWRFC |
HPC |
SEW |
|
|
Day 1 Fcst |
-0.042 |
-0.120 |
0.126 |
|
|
Day 1 Fcst |
-0.169 |
-0.479 |
0.502 |
|
|
Day 2 Fcst |
-0.119 |
-0.102 |
-0.084 |
|
|
Day 2 Fcst |
-0.477 |
-0.410 |
-0.336 |
|
|
Day 3 Fcst |
-0.189 |
-0.098 |
-0.062 |
|
|
Day 3 Fcst |
-0.754 |
-0.393 |
-0.248 |
|
|
|
|
|
|
|
|
|
|
|
|
|
|
All Periods |
-0.117 |
-0.107 |
-0.007 |
|
|
All Periods |
-0.467 |
-0.427 |
-0.027 |
|
|
|
|
|
|
|
|
|
|
|
|
|
|
Forecast RMS Error |
|
|
Forecast RMS Error |
|||||||
|
6-hour Time Period, All Stations |
|
|
24-hour Time Period, All Stations |
|||||||
|
|
NWRFC |
HPC |
SEW |
|
|
|
NWRFC |
HPC |
SEW |
|
|
Day 1 Fcst |
0.517 |
0.436 |
0.654 |
|
|
Day 1 Fcst |
1.249 |
1.183 |
2.095 |
|
|
Day 2 Fcst |
0.481 |
0.432 |
0.573 |
|
|
Day 2 Fcst |
1.282 |
1.183 |
1.827 |
|
|
Day 3 Fcst |
0.549 |
0.431 |
0.589 |
|
|
Day 3 Fcst |
1.572 |
1.123 |
1.834 |
|
|
|
|
|
|
|
|
|
|
|
|
|
|
All Periods |
0.517 |
0.433 |
0.606 |
|
|
All Periods |
1.375 |
1.163 |
1.923 |
|
|
|
|
|
|
|
|
|
|
|
|
|
|
Forecast Error (Mean
Absolute Error) |
|
|
Forecast Error (Mean
Absolute Error) |
|||||||
|
6-hour Time Period, All Stations |
|
|
24-hour Time Period, All Stations |
|||||||
|
|
NWRFC |
HPC |
SEW |
|
|
|
NWRFC |
HPC |
SEW |
|
|
Day 1 Fcst |
0.321 |
0.269 |
0.422 |
|
|
Day 1 Fcst |
0.873 |
0.781 |
1.427 |
|
|
Day 2 Fcst |
0.298 |
0.275 |
0.342 |
|
|
Day 2 Fcst |
0.827 |
0.719 |
1.160 |
|
|
Day 3 Fcst |
0.335 |
0.276 |
0.356 |
|
|
Day 3 Fcst |
1.007 |
0.712 |
1.237 |
|
|
|
|
|
|
|
|
|
|
|
|
|
|
All Periods |
0.318 |
0.273 |
0.373 |
|
|
All Periods |
0.902 |
0.737 |
1.274 |
|
Table 6 Daily QPF Verification
Statistics for the
Figures 26 and 27Comparison of Precipitation Forecasts
for
Figures 27 and 28Comparison of Precipitation Forecasts
for
Figures 29 and 30 Comparison of Precipitation Forecasts
for the
Figures 31 and 32 Scatter Diagrams
of Observed Precipitation and NWRFC QPF for the
|
|
||||||||||
|
Event Performance Statistics |
||||||||||
|
Event Performance -
MAJOR EVENTS |
|
|
Event Performance -
MAJOR EVENTS |
|||||||
|
1.00"+ in
6-hour Time Period |
|
|
4.00"+ in
24-hour Time Period |
|||||||
|
|
NWRFC |
HPC |
SEW |
|
|
|
NWRFC |
HPC |
SEW |
|
|
POD |
0.57 |
0.65 |
1.00 |
|
|
POD |
0.41 |
0.33 |
1.00 |
|
|
FAR |
0.39 |
0.22 |
0.67 |
|
|
FAR |
0.21 |
0.00 |
0.25 |
|
|
CSI |
0.41 |
0.55 |
0.33 |
|
|
CSI |
0.37 |
0.33 |
0.75 |
|
|
|
|
|
|
|
|
|
|
|
|
|
|
Event Performance -
MODERATE EVENTS |
|
|
Event Performance -
MODERATE EVENTS |
|||||||
|
0.50"+ in 6-hour Time Period |
|
|
2.00"+ in 24-hour Time Period |
|||||||
|
|
NWRFC |
HPC |
SEW |
|
|
|
NWRFC |
HPC |
SEW |
|
|
POD |
0.80 |
0.84 |
1.00 |
|
|
POD |
0.97 |
1.00 |
1.00 |
|
|
FAR |
0.14 |
0.15 |
0.37 |
|
|
FAR |
0.09 |
0.08 |
0.50 |
|
|
CSI |
0.71 |
0.73 |
0.63 |
|
|
CSI |
0.89 |
0.92 |
0.50 |
|
|
|
|
|
|
|
|
|
|
|
|
|
|
Event Performance -
MINOR EVENTS |
|
|
Event Performance -
MINOR EVENTS |
|||||||
|
0.25"+ in 6-hour Time Period |
|
|
1.00"+ in 24-hour Time Period |
|||||||
|
|
NWRFC |
HPC |
SEW |
|
|
|
NWRFC |
HPC |
SEW |
|
|
POD |
0.90 |
0.86 |
0.89 |
|
|
POD |
0.97 |
0.92 |
1.00 |
|
|
FAR |
0.10 |
0.03 |
0.08 |
|
|
FAR |
0.03 |
0.00 |
0.00 |
|
|
CSI |
0.82 |
0.84 |
0.83 |
|
|
CSI |
0.95 |
0.92 |
1.00 |
|
Table 7 Event QPF Verification
Statistics for the
|
|
||||||||||
|
Daily Forecast Performance Statistics |
||||||||||
|
Forecast Bias (Mean
Algebraic Error) |
|
|
Forecast Bias (Mean
Algebraic Error) |
|||||||
|
6-hour Time Period, All Stations |
|
|
24-hour Time Period, All Stations |
|||||||
|
|
NWRFC |
HPC |
SEW |
|
|
|
NWRFC |
HPC |
SEW |
|
|
Day
1 Fcst |
-0.178 |
-0.325 |
0.416 |
|
|
Day
1 Fcst |
-0.713 |
-1.300 |
1.663 |
|
|
Day
2 Fcst |
-0.293 |
-0.286 |
0.178 |
|
|
Day
2 Fcst |
-1.170 |
-1.143 |
0.713 |
|
|
Day
3 Fcst |
-0.257 |
-0.257 |
0.252 |
|
|
Day
3 Fcst |
-1.028 |
-1.027 |
1.007 |
|
|
|
|
|
|
|
|
|
|
|
|
|
|
All Periods |
-0.243 |
-0.289 |
0.282 |
|
|
All Periods |
-0.970 |
-1.157 |
1.128 |
|
|
|
|
|
|
|
|
|
|
|
|
|
|
Forecast RMS Error |
|
|
Forecast RMS Error |
|||||||
|
6-hour Time Period, All Stations |
|
|
24-hour Time Period, All Stations |
|||||||
|
|
NWRFC |
HPC |
SEW |
|
|
|
NWRFC |
HPC |
SEW |
|
|
Day
1 Fcst |
0.893 |
0.876 |
0.785 |
|
|
Day
1 Fcst |
1.742 |
2.238 |
2.336 |
|
|
Day
2 Fcst |
0.914 |
0.808 |
0.315 |
|
|
Day
2 Fcst |
2.282 |
2.023 |
1.058 |
|
|
Day
3 Fcst |
0.883 |
0.784 |
0.391 |
|
|
Day
3 Fcst |
2.185 |
1.875 |
1.235 |
|
|
|
|
|
|
|
|
|
|
|
|
|
|
All Periods |
0.897 |
0.824 |
0.538 |
|
|
All Periods |
2.083 |
2.051 |
1.643 |
|
|
|
|
|
|
|
|
|
|
|
|
|
|
Forecast Error (Mean
Absolute Error) |
|
|
Forecast Error (Mean
Absolute Error) |
|||||||
|
6-hour Time Period, All Stations |
|
|
24-hour Time Period, All Stations |
|||||||
|
|
NWRFC |
HPC |
SEW |
|
|
|
NWRFC |
HPC |
SEW |
|
|
Day
1 Fcst |
0.524 |
0.472 |
0.509 |
|
|
Day
1 Fcst |
1.273 |
1.640 |
1.663 |
|
|
Day
2 Fcst |
0.465 |
0.436 |
0.212 |
|
|
Day
2 Fcst |
1.502 |
1.446 |
0.713 |
|
|
Day
3 Fcst |
0.532 |
0.417 |
0.275 |
|
|
Day
3 Fcst |
1.444 |
1.374 |
1.007 |
|
|
|
|
|
|
|
|
|
|
|
|
|
|
All Periods |
0.507 |
0.441 |
0.332 |
|
|
All Periods |
1.407 |
1.486 |
1.128 |
|
Table 8 Daily QPF Verification
Statistics for the
Figures 33 and 34Comparison of Precipitation Forecasts for Cushman Dam, Washington (CSHW1).
Figures 35 and 36Comparison of Precipitation Forecasts
for
Figures 37 and 38Comparison of Precipitation Forecasts
for the
Figures 39 and 40 Scatter Diagrams
of Observed Precipitation and NWRFC QPF for the
|
|
||||||||||
|
Event Performance Statistics |
||||||||||
|
Event Performance -
MAJOR EVENTS |
|
|
Event Performance -
MAJOR EVENTS |
|||||||
|
1.00"+ in
6-hour Time Period |
|
|
4.00"+ in
24-hour Time Period |
|||||||
|
|
NWRFC |
HPC |
SEW |
|
|
|
NWRFC |
HPC |
SEW |
|
|
POD |
0.42 |
0.21 |
|
|
|
POD |
|
|
|
|
|
FAR |
0.17 |
0.00 |
|
|
|
FAR |
1.00 |
|
|
|
|
CSI |
0.38 |
0.21 |
|
|
|
CSI |
0.00 |
|
|
|
|
|
|
|
|
|
|
|
|
|
|
|
|
Event Performance -
MODERATE EVENTS |
|
|
Event Performance -
MODERATE EVENTS |
|||||||
|
0.50"+ in 6-hour Time Period |
|
|
2.00"+ in 24-hour Time Period |
|||||||
|
|
NWRFC |
HPC |
SEW |
|
|
|
NWRFC |
HPC |
SEW |
|
|
POD |
0.74 |
0.69 |
|
|
|
POD |
0.60 |
0.60 |
|
|
|
FAR |
0.18 |
0.17 |
|
|
|
FAR |
0.25 |
0.00 |
|
|
|
CSI |
0.63 |
0.60 |
|
|
|
CSI |
0.50 |
0.60 |
|
|
|
|
|
|
|
|
|
|
|
|
|
|
|
Event Performance -
MINOR EVENTS |
|
|
Event Performance -
MINOR EVENTS |
|||||||
|
0.25"+ in 6-hour Time Period |
|
|
1.00"+ in 24-hour Time Period |
|||||||
|
|
NWRFC |
HPC |
SEW |
|
|
|
NWRFC |
HPC |
SEW |
|
|
POD |
0.80 |
0.82 |
|
|
|
POD |
1.00 |
1.00 |
|
|
|
FAR |
0.10 |
0.07 |
|
|
|
FAR |
0.00 |
0.00 |
|
|
|
CSI |
0.74 |
0.77 |
|
|
|
CSI |
1.00 |
1.00 |
|
|
Table 9 Event QPF Verification
Statistics for the
|
|
||||||||||
|
Daily Forecast Performance Statistics |
||||||||||
|
Forecast Bias (Mean
Algebraic Error) |
|
|
Forecast Bias (Mean
Algebraic Error) |
|||||||
|
6-hour Time Period, All Stations |
|
|
24-hour Time Period, All Stations |
|||||||
|
|
NWRFC |
HPC |
SEW |
|
|
|
NWRFC |
HPC |
SEW |
|
|
Day
1 Fcst |
0.004 |
-0.224 |
|
|
|
Day
1 Fcst |
0.014 |
-0.897 |
|
|
|
Day
2 Fcst |
-0.111 |
-0.125 |
|
|
|
Day
2 Fcst |
-0.444 |
-0.500 |
|
|
|
Day
3 Fcst |
-0.132 |
-0.097 |
|
|
|
Day
3 Fcst |
-0.529 |
-0.388 |
|
|
|
|
|
|
|
|
|
|
|
|
|
|
|
All Periods |
-0.080 |
-0.149 |
|
|
|
All Periods |
-0.320 |
-0.595 |
|
|
|
|
|
|
|
|
|
|
|
|
|
|
|
Forecast RMS Error |
|
|
Forecast RMS Error |
|||||||
|
6-hour Time Period, All Stations |
|
|
24-hour Time Period, All Stations |
|||||||
|
|
NWRFC |
HPC |
SEW |
|
|
|
NWRFC |
HPC |
SEW |
|
|
Day
1 Fcst |
0.417 |
0.382 |
|
|
|
Day
1 Fcst |
0.688 |
1.121 |
|
|
|
Day
2 Fcst |
0.326 |
0.269 |
|
|
|
Day
2 Fcst |
0.837 |
0.677 |
|
|
|
Day
3 Fcst |
0.363 |
0.235 |
|
|
|
Day
3 Fcst |
0.969 |
0.601 |
|
|
|
|
|
|
|
|
|
|
|
|
|
|
|
All Periods |
0.370 |
0.302 |
|
|
|
All Periods |
0.839 |
0.832 |
|
|
|
|
|
|
|
|
|
|
|
|
|
|
|
Forecast Error (Mean
Absolute Error) |
|
|
Forecast Error (Mean
Absolute Error) |
|||||||
|
6-hour Time Period, All Stations |
|
|
24-hour Time Period, All Stations |
|||||||
|
|
NWRFC |
HPC |
SEW |
|
|
|
NWRFC |
HPC |
SEW |
|
|
Day
1 Fcst |
0.291 |
0.250 |
|
|
|
Day
1 Fcst |
0.559 |
0.897 |
|
|
|
Day
2 Fcst |
0.203 |
0.206 |
|
|
|
Day
2 Fcst |
0.673 |
0.500 |
|
|
|
Day
3 Fcst |
0.253 |
0.169 |
|
|
|
Day
3 Fcst |
0.798 |
0.419 |
|
|
|
|
|
|
|
|
|
|
|
|
|
|
|
All Periods |
0.249 |
0.208 |
|
|
|
All Periods |
0.677 |
0.605 |
|
|
Table 10 Daily QPF Verification
Statistics for the
Figures 40 and 41Comparison of Precipitation Forecasts
for
Figures 42 and 43Comparison of Precipitation Forecasts for Elwha RS, Washington (ELHW1).
Flood
Forecast Verification
Heavy precipitation on December 2 and 3, 2007 caused
extensive flooding from the central
|
|
|
Peak |
|||
|
Forecast
Point |
NWSID |
Stage |
Time of Peak |
Existing Record |
Date |
|
|
|
(ft) |
|
(ft) |
|
|
Mary's
River near Philomath |
PHIO3 |
21.02 |
12/4 05:00Z |
21.07 |
|
|
|
SUVO3 |
29.02 |
12/4 17:00Z |
34.52 |
|
|
|
MCMO3 |
55.95 |
12/4 23:45Z |
59.33 |
|
|
|
DLLO3 |
19.03 |
12/4 05:15Z |
19.34 |
|
|
|
FRMO3 |
32.66 |
12/6 02:30Z |
37.12 |
|
|
Johnson
Creek at Sycamore |
SYCO3 |
11.92 |
12/3 18:30Z |
14.68 |
|
|
|
ESTO3 |
20.38 |
12/4 08:00Z |
27.57 |
|
|
|
MPLO3 |
21.47 |
12/4 05:30Z |
30.21 |
|
|
|
TIDO3 |
21.81 |
12/4 05:30Z |
27.44 |
|
|
|
SILO3 |
19.22 |
12/3 22:30Z |
28.62 |
|
|
|
BEAO3 |
18.86 |
12/3 20:00Z |
23.40 |
|
|
|
TLMO3 |
20.45 |
12/3 19:30Z |
22.84 |
|
|
|
FSSO3 |
24.44 |
12/3 19:30Z |
29.56 |
|
|
|
WILW1 |
26.65 |
12/4 00:45Z |
27.28 |
|
|
|
NASW1 |
14.74* |
12/3 16:30Z |
19.26 |
|
|
|
KELW1 |
21.6* |
12/4 00:15Z |
29.50 |
|
|
|
CENW1 |
74.78 |
12/4 11:30Z |
74.31 |
|
|
|
CGMW1 |
20.23 |
12/4 18:00Z |
19.98 |
|
|
|
CRPW1 |
26.05 |
12/5 08:00Z |
25.22 |
|
|
|
SATW1 |
36.63 |
12/4 03:30Z |
38.87 |
|
|
|
ORTW1 |
8.35 |
12/4 02:15Z |
11.37 |
|
|
|
NISW1 |
11.29 |
12/4 01:15Z |
12.18 |
|
|
|
DSRW1 |
13.75 |
12/4 04:00Z |
17.01 |
|
|
|
SRPW1 |
18.12 |
12/3 22:30Z |
17.75 |
|
|
|
ELWW1 |
24.63 |
12/3 23:00Z |
24.20 |
|
|
|
GLBW1 |
16.82 |
12/4 02:00Z |
22.49 |
|
|
|
SQUW1 |
14.31 |
12/4 04:30Z |
21.55 |
|
|
|
TOLW1 |
9.65 |
12/3 21:45Z |
12.92 |
|
|
|
CRNW1 |
56.99 |
12/4 18:00Z |
60.70 |
|
|
|
MROW1 |
16.32 |
12/4 15:30Z |
25.30 |
|
|
|
SNAW1 |
27.87 |
12/4 22:00Z |
30.12 |
|
|
S.F.
Stillaguamish near |
GFLW1 |
14.96 |
12/4 00:30Z |
19.70 |
|
|
Stillaguamish near |
ARLW1 |
15.18 |
12/4 05:39Z |
21.06 |
|
|
|
CONW1 |
30.60 |
12/4 13:15Z |
42.21 |
|
Table 11: December 2007 event peak discharge and peak of record.
Table 12: Date and time where stage rose above
action stages.
Most of the rivers draining
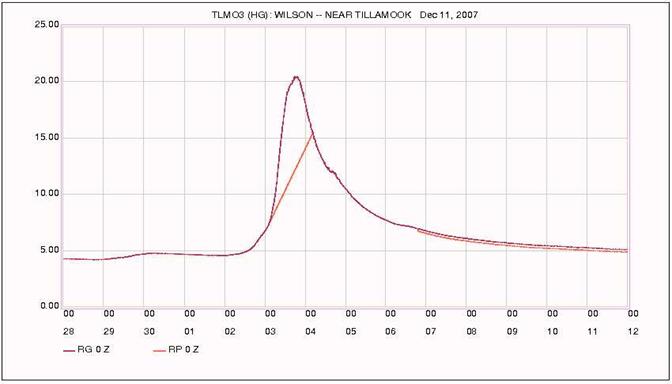
Figure 44 Hydrograph of the Wilson River near Tillamook,
Oregon
The first forecast issued by the NWRFC, that showed
the
Figure 45 Peak Stage
Forecast Lead Time for the
Figure 46 River Stage Forecasts Issued for the
Adjacent to the
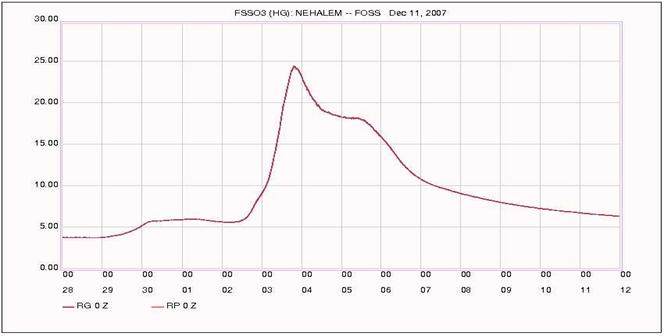
Figure 47 Hydrograph of the
The
first forecast that indicated that the
Figure 48Peak Stage
Forecast Lead Time for the
Figure 49
River Stage Forecasts Issued for the
The
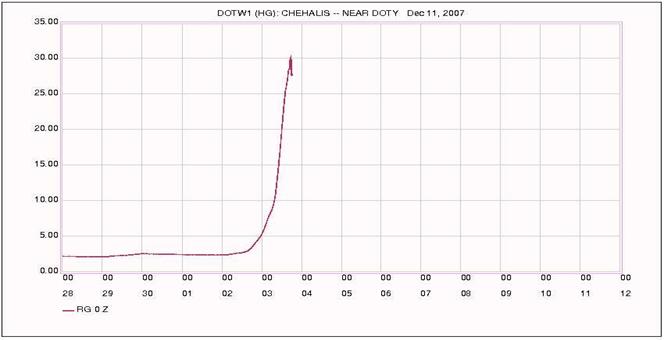
Figure 50
Hydrograph of the
The
first forecast issued, that showed that the
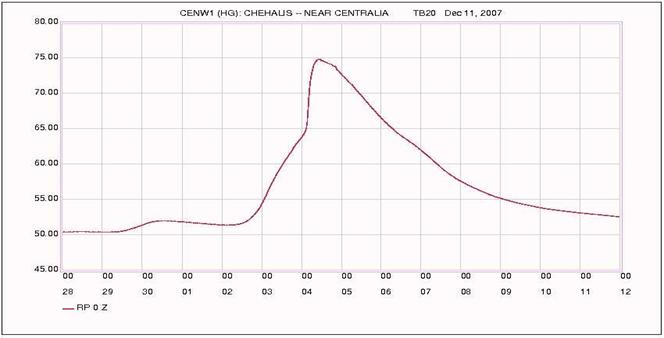
Figure 51 Hydrograph of the
The
next model run was made at 12/03 1644Z after the previous day's temperature and
precipitation observations were quality controlled and new QPF was issued.At Doty a record stage of 27.5 feet was forecasted.The river was
flowing at 26.8 feet when the forecast was issued.The first major flood at
Figure 52Peak Stage
Forecast Lead Time for the
Figure 53
River Stage Forecasts Issued for the
A
comparison of the hydrographs from the December 2007 and the February 1996
floods shows a markedly different response in the
Figure 54
Comparison of the Dec 2007 Flood with the Feb 1996 Flood.
As
with the
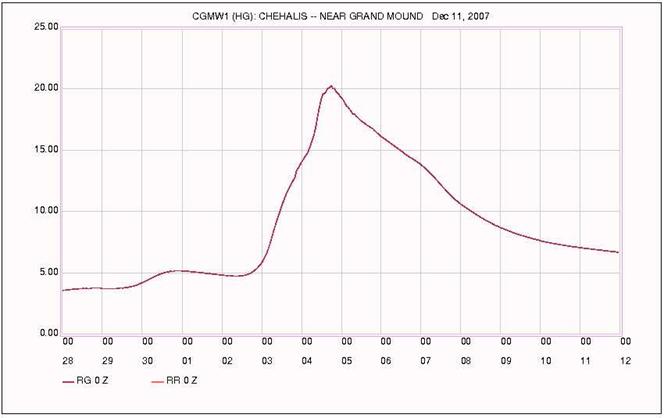
Figure 55
Hydrograph of the
Figure 56 Peak Stage
Forecast Lead Time for the
Figure 57 River Stage Forecasts Issued for the
The
Porter gage on the
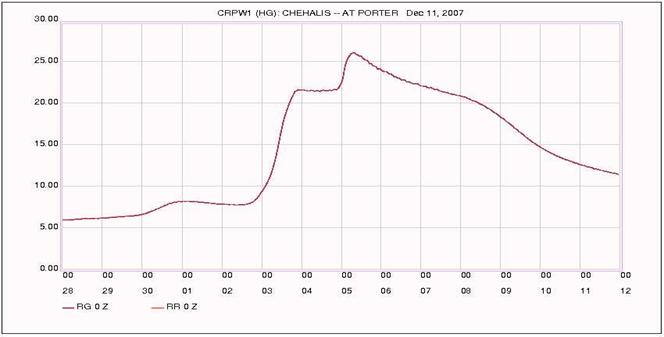
Figure 58
Hydrograph for the
Figure 59 Peak Stage Forecast
Lead Time for the
Figure 60
River Stage Forecasts Issued for the
The
gage on the
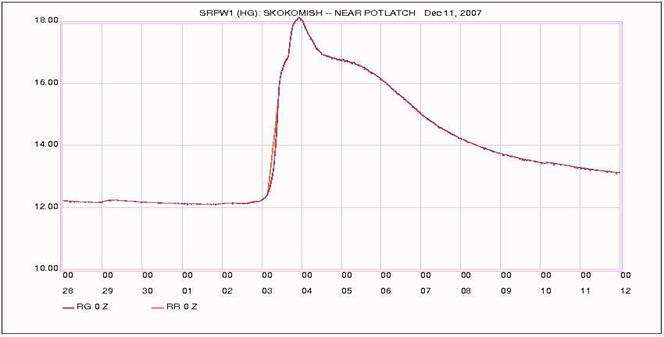
Figure 61
Hydrograph for the
Forecasts
that put the river above flood stage were issued four days prior to
occurrence.This location had the
longest lead time of all the forecast locations, which is typical as this river
is the one that is most susceptible to flooding.
Figure 62Peak Stage
Forecast Lead Time for the
Figure 63
River Stage Forecasts Issued for the
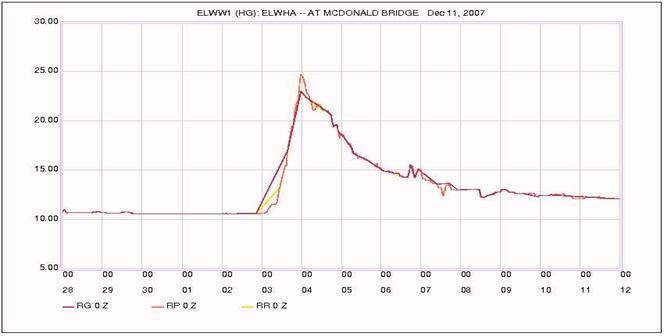
Figure 64
Hydrograph for the
Figure 65 Peak Stage
Forecast Lead Time for the
Figure 66
River Stage Forecasts Issued for the