Libby Dam and
Bonners Ferry Forecast Analysis and Findings June 2006
Summary
The following report is a compilation of information
provided from NWRFC including reports filed by the USACE RCC and Service
Hydrologists from
Meteorological
Summary
Record daily temperatures occurred
during the second and third week of May of 2006 in the 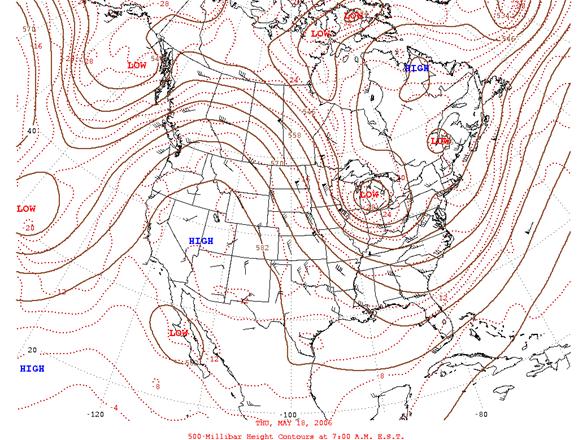
Figure 1: 500mb heights May 18th showing a high pressure
ridge over the
In south east British
The NWRFC water supply precipitation index describes the precipitation recovery in the Kootenay basin for the month of May. Water supply precipitation analysis was 46 percent of normal on May 15th and by the end of May the Kootenay basin was 96 percent of normal. Dry conditions dominated the region during a period from May 30th to June 2nd.
Early in June an upper level 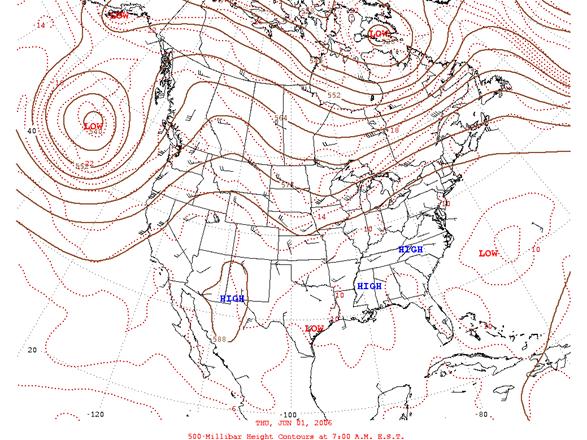
Figure 2: 500mb
Heights June 1 shows low pressure off the West coast of the
Three precipitation events impacted the Kootenay
basin June 5th, June 8th and June 15th. The rain events were caused by a trough
positioned off the West coast of the
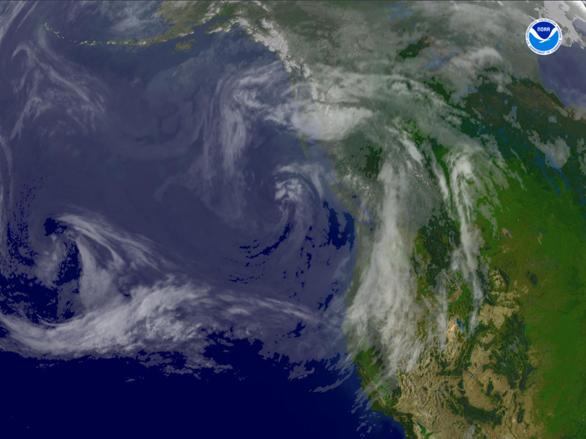
Figure 3: An area of low pressure beginning to move
inland over parts of
Weather models indicated significant precipitation forecast
for the second week of June. The
atmosphere was very unstable due to a mix of merging
The center of the cold core low moved east pushing warm
moist and unstable north into the eastern
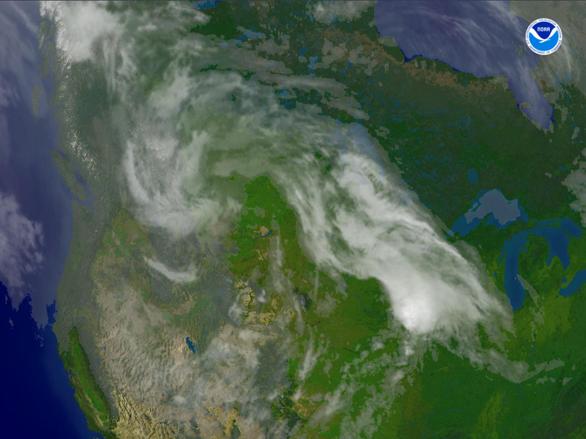
Figure 4: Data Elements: A frontal system bringing showers and thunderstorms to the Pacific Northwest, eastward to parts of the northern Rocky Mountains June 15th 09:35:56 UTC.
The atmosphere
contained high precipitable water and that moist air moved from east to west
over the continental divide. Rains fell
in the eastern sections of the Kootenay,
Libby Dam precipitation for June 2006 was 4.98 inches which
was 266% of normal June Libby Dam (1.87 inches). June 14th and 17th were the 8th and 6th
wettest days of June since 1986 at Libby
Dam. On June 8th.
The
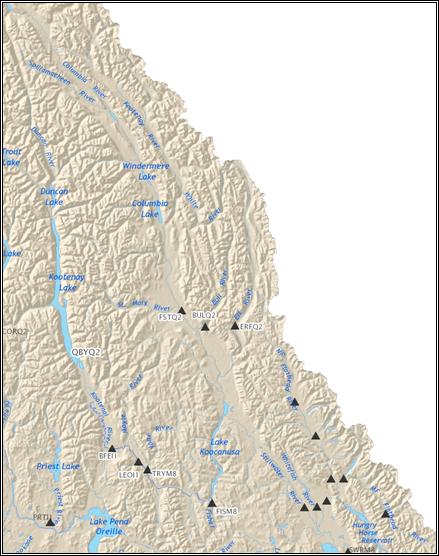
Figure 5
Above Libby Dam (LYDM8) nearly 90 percent of the inflow to the
reservoirs (
During the snow accumulation season 2006 measurements of
snow water equivalent (SWE) made during May 1st at Kootenay basin
snow sites indicated between 75% - 105% of normal SWE with a Kootenay snow
water index of 99% as reported by the River Forecast Center Environmental
Canada. The spring 2006 snow melt was
accelerated by several days of record high temperatures during the last two
weeks of May causing above normal melt rates.
The runoff for May at FSTQ2 was 142% of normal. During a period from May 18th to
June 8th Libby Dam was operated at full power capacity releasing
24,000cfs. The LYDM8 pool elevation
increased approximately 25 feet leaving 5 feet of usable storage. At Bonners Ferry the rapid melt in May is
evident in figure 6 below. The river
remained within 4.5 feet of flood stage (64 feet) through early June when
several moderate rain events between June 8th and June 16th
nearly filled
Figure 6: BFEI1 River Stage May 6th - June 23rd
No Observations recorded 6/7-6/10
Figure 7: Libby Dam observed data 5/14 to 6/27 listed top to bottom: Pool elevation, Daily Inflow, Daily Outflow and Precipitation. The precipitation amount was not reported June 7-10.
NWRFC Flood Operations
On Monday June 12th the NWRFC issued a Libby Dam forecast indicating a nearly full
Pool by the end of the week.
The forecast precipitation for June 12th was extreme with day
3 forecast precipitation amounts at Duncan Dam of 2.35 inches (June monthly
average a Duncan Dam is 2.40). The
precipitation forecast points that contribute to Libby Dam inflow and Bonners
Ferry predicted a general 1.50 inches for Wednesday June 14th with
amounts of: 1.50 inches Elk River
Fernie, BC. 1.63 inches 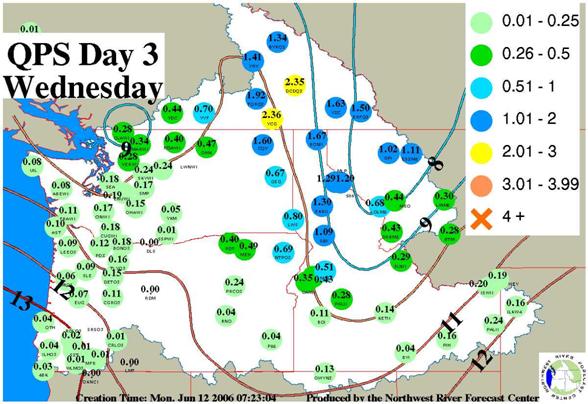
Figure 8 Precipitation Forecast for June 14th created June 12th.
Subsequent precipitation forecasts indicated less precipitation and were under forecast. Further illustration of river model input precipitation is discussed in the findings and recommendations section of this document.
River Forecast
Description
Short term river forecasts provided by the NWRFC for Libby
dam inflow varied based on precipitation forecasts input to the river
model. The inflow forecast issued on
June 12th incorporated the precipitation
amounts in figure 8. The forecast
created on June 15th incorporated a reduced precipitation forecast (figure
10).
Figure 9: Libby Inflow Forecasts and Observed
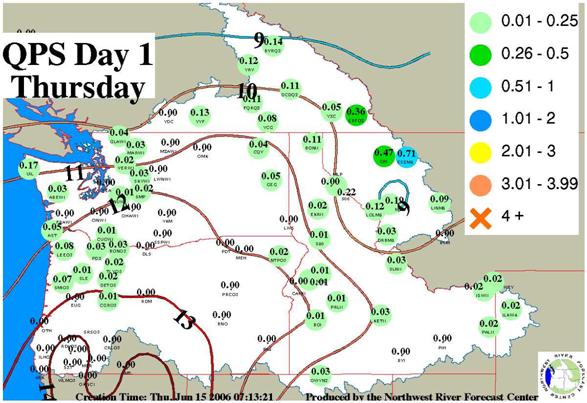
Figure 10 Precipitation forecast June 15th for June 15th
Bonners
Ferry
The River forecasts at Bonners
Ferry (BFEI1) were controlled by three key factors.
The routed water from Libby Dam regulation, local area
contribution between Libby Dam and Bonners Ferry and a balance factor used to
adjust the river stage at BFEI1.
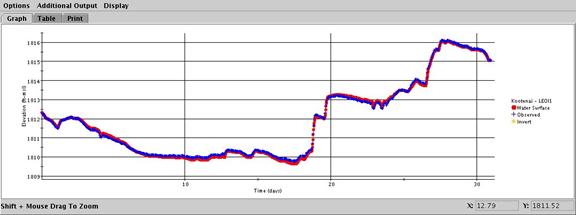
Figure 11 Bonners Ferry Forecast and Observed
Forecast regulations were made
for Libby Dam in coordination with the COE.
Several iterations of the river model forecast were created during June
16th and 17th to account for the change in regulation
plans. On June 17th Libby Dam
increased outflow (figure 7) and forecasts were updated to account for
regulation changes.
Bonners Ferry
Balance:
Backwater conditions affect the lower reaches of the
The plot below (figure 12.) was produced prior to the June 17th Bonners Ferry Flood, shows historical BFEI1 balances or differences between the three variable lookup table and observed BFEI1 stage heights. The graphic and summation guidance below was used on the operational floor for the June 17th event.
BFEI1 Balances adjusted to the observed value.
BFEI1 (computed) 60 -
65 -2' >
-5' (mostly between -2' and -3' )
55 - 59 +1'
> -2'
45 - 54 +1.5 > -1.5'
Figure 12 Bonners Ferry Historical Balance
Below is a graphic of BFEI1 balances for the mid
June Bonners Ferry Flood.
Figure 13 Computed stage - Observed
stage
In general, the observed BFEI1 balances fell within the
Balance Guidance for the June 17th event.
Water
Supply
The following plot depicts the NWRFC water supply forecasts
for April – July. The forecasts were generated from three different
methods. The LYDM8W and LYDM8TW are
generated through ESP. The WSF line with
a dot is the official coordinated regression based water supply forecast. The larger dot with no line connecting is the
forecast from the COE. Observed
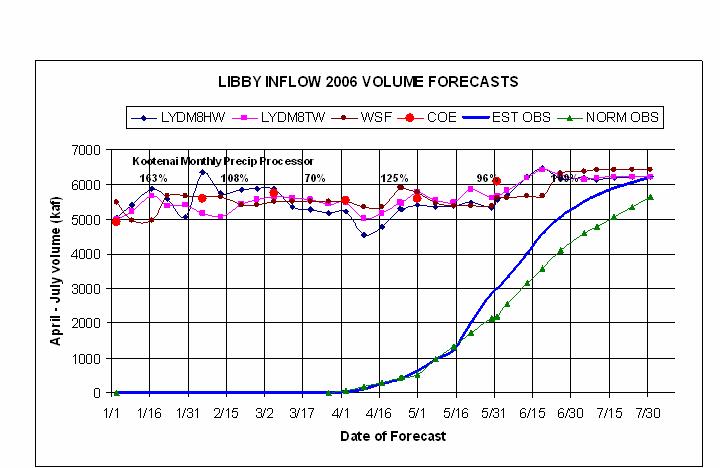
Figure 14: Libby Dam Inflow Forecast from Water Supply, ESP and the COE Plotted with Observed Runoff
Notice the departure from normal runoff starting 5/16 caused by above normal snow melt rates.
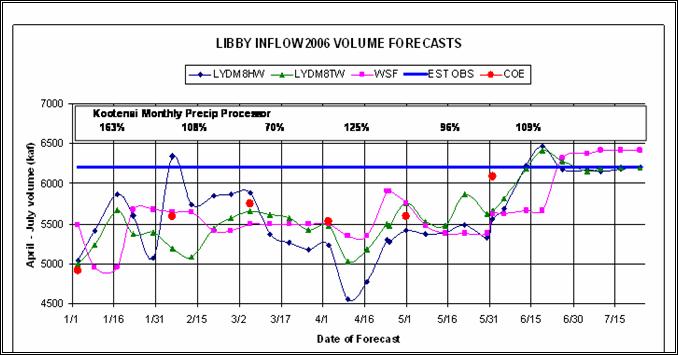
Figure 15 Libby Dam Inflow Forecast
from Water Supply, ESP and the COE.
All forecasts increased after the rain events around the 6/15 time frame. All forecasts were underestimated for the April-July volume with the COE projection plotted on 5/31 being the best estimate. Water supply forecasts increased after accounting for the above normal precipitation in June.
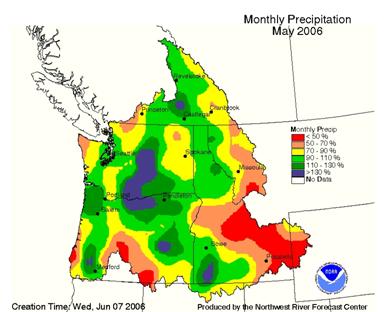
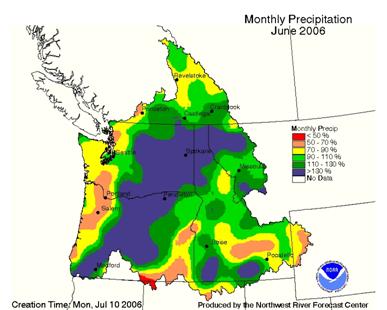
Figure 16: May and June Monthly
Precipitation. Notice the increase from
May to June. Also note the general
pattern of precipitation from Southwest to Northeast.
Products:
While assessing forecast hydrographs for Bonners Ferry the NWRFC received several comments from customers.
-The RCC indicated that at Bonners Ferry there was a large disconnect between observed
and forecasted data, especially during the early high water.
-The forecasts seemed to fluctuate wildly from one day to the next. There was little
consistency, which made operating Libby difficult. Both of the big events (June 8 and
June 16) were
significantly under forecasted at Libby.
Services:
Corps of Engineers Reservoirs Control Center (RCC) provided the following comments:
“Model runs were created in a timely manner,
which allowed the Corps to modify operations and coordinate with the region
effectively. There was a lot of dialog
between RCC and RFC which helped us understand what the forecaster was
thinking. I think these conversations
helped improve the forecasts.
Occasionally RCC was able to provide RFC information, which sometimes
helped them prepare the forecasts. RFC
worked with RCC fine-tuning initial conditions and getting best inflow
estimates for the early forecast periods.
There was great cooperation in this respect. RFC generally called when conditions changed
in the basin, which gave RCC a heads up to look at the new forecast.”
The Service Hydrologist Spokane wrote the following:
“I spoke briefly with the POC from
I also asked the emergency manager Boundary
county from whom and what agency did he receive his forecasts. He told me that he used exclusively the
forecasts from
Findings and
Recommendations:
Finding: Precipitation
forecasts under estimated precipitation amounts and were reduced with
successive runs. On June 15th and June16th heavy rainfall was occurring along the spine
of the
The plot above contains observed precipitation data gathered
at SNOTEL sites in the proximity of the
Finding: The QPS was not updated when Heavy rains prompted
MSO to issue a Small Stream Flood Warning for
Finding: FMAP Factors were applied during the event.
Recommendation: NWRFC staff will coordinate during AM
briefing about application of factors and distinguish between widespread
precipitation and convective events.
Finding: NWRFC provided excellent coordination and timely forecasts for our customers both internal and external.
Finding: The MAP did not adequately represent precipitation
amounts in the
Recommendation: Explore better relationships for deriving MAP in this data sparse area.
Finding: Bonners Ferry Balance guidance was inadequate
during the early stages of this event.
Recommendation: Provide guidance within IFP in the form of ts-plot.
Recommendation: Provide proof-of -concept for the implementation of FloodWav for BFEI1
Recommendation: Incorporate Floodwav model for Bonners Ferry backwater condition.
Bonners Ferry
Improvement:
The
A FLDWAV model from
FLDWAV Model
Topology/Description:
94.3 River Miles
Study Period -
Upstream Boundary - LEOI1 flow (RFS input)
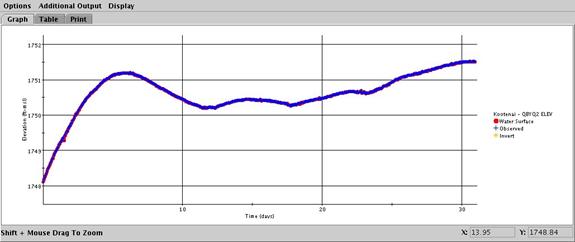
Downstream Boundary -
QBYQ2 elevation (RFS input)
Lateral Inflow - EASI1 flow (RFS input -
Forecast Points - BFEI1 stage, PORI1 stage
8 cross sections (5 from LEOI1 to BFEI1). Cross sections from a 2002-2003 USGS study.
Preliminary Results/
Graphics:
Preliminary results indicate FLDWAV can produce BFEI1 stage
forecasts for the May-June 2006 period within half a foot of observed.
Leonia Flow
(LEOI1) - Upstream Boundary
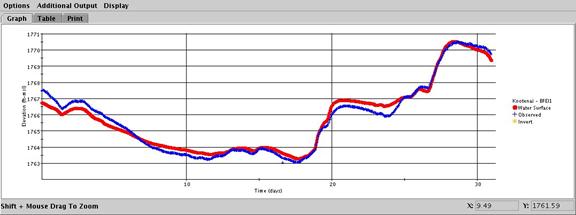
Bonners Ferry
Stage (BFEI1) - Observed vs. Simulated
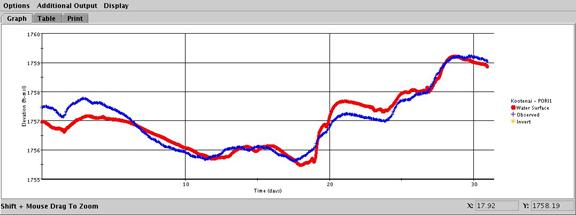
Porthill Stage
(PORI1) - Observed vs. Simulated
With model refinements outlined below, the preliminary
FLDWAV model can be ready for operational use.
TIME
- One year data
set
(3 day)
- Additional cross
sections and inclusion of
NPS HEC-RAS cross
sections that contain greater levee definition
(1 week)
- Recalb
(4
days)
- FLDWAV operation
creation and test (1 days)
- RFS segment
creation and test (2 days)
Finding: NWRFC updated LYDM8 segment to account for
Libby pool over 2459.00
the pool elevation was raised to 2459.50.
Recommendation: Consult the RCC on actual full pool elevation
at LYDM8.
Finding: The ESP forecast created June 1st with 10-days of QPS did not adequately reflect the hydrologic risk for filling Libby Dam. Assuming that Libby was to continue with the June 1 outflow of 25 kcfs, how many of the ESP years would Libby fill on June 30 and of these years what inflow would Libby have to pass? Volume needed to fill in 30 days = 409 kaf to fill + 1488 kaf (25kcfs for 30days) = 1897 kaf.
# years fill* June 30 inflow
range
Libby Headwater with 10 day QPF 4 years 26-52.5 kcfs
Libby Headwater without 10 day QPF 21 years 17-62.2 kcfs
Libby Total without 10 day QPF 25 years 18-66 kcfs
Libby Total with 10 day QPF 6 years 20-61 kcfs
* based on 45 years of record
Recommendation: Discuss the effects of 10day QPS in ESP specifically related to this event.
Finding: NWRFC does not create a Peak Flow prediction for Libby Dam inflow in ESP.
Recommendation: Incorporate LYDM8T into Peak Flow ESPADP batch file.
Finding: Multiple outputs were delivered to Bonners Ferry POC via RCC
Recommendation: Contact the RCC and determine why this happened and see that, in the future, the forecasts delivered are consistent with NWRFC forecast guidance.
Finding: The NWRFC web page does not have a bank full stage for BFEI1
Recommendation: Determine a bank full stage for indication on the web-page.
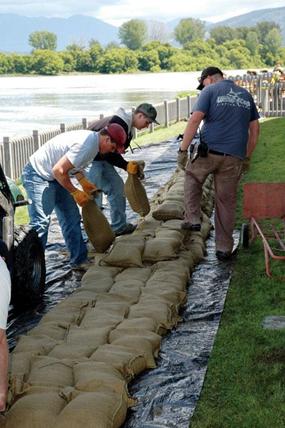
Flood Event Impacts:
The
following was collected from the
-Residents
reported groundwater seeping into yards and daylight basements.
-Docks
also were torn from their riverbank moorings.
-Landscaping
was washed away from banks in peoples yards and some lawn furniture
and ornaments were swept downstream.
-Minor
flooding occurred at the Kootenai River Inn
-$2.6
million in crop damage was reported.
-Several roads were closed and widespread lowland flooding
occurred along the river.
APPENDIX
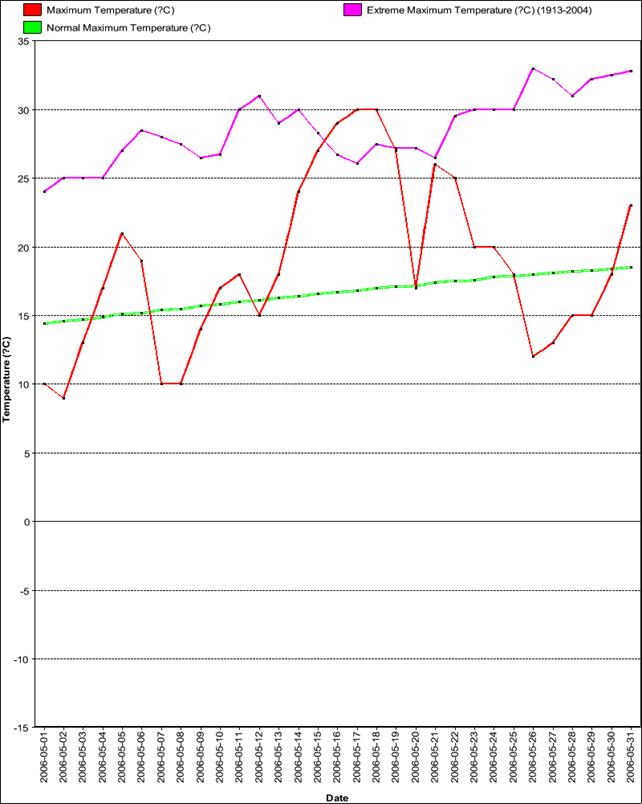
Figure 17 Month Temperature Graph for May 2006 Fernie British Coulumbia

Figure 18Month Temperature Graph for
May 2006
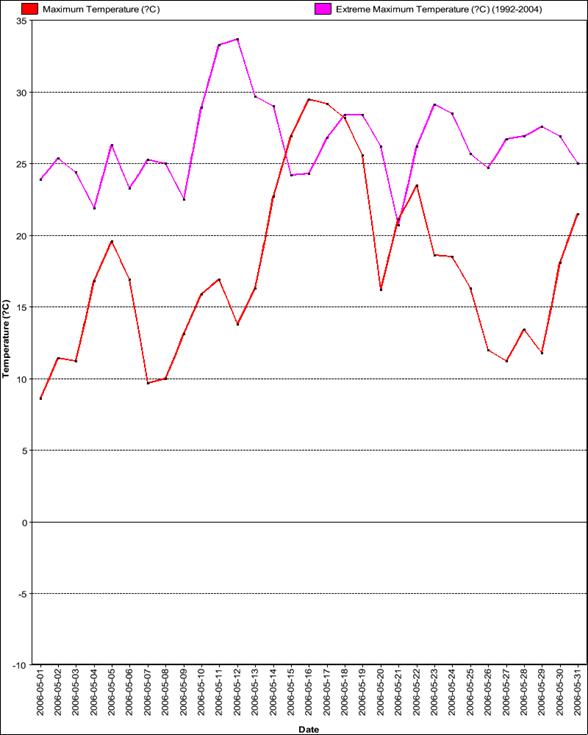
Figure 19 Month Temperature Graph for
May 2006 Sparwood
000
SXUS76 KOTX 170845
REROTX
RECORD EVENT
REPORT
NATIONAL WEATHER
SERVICE
146 AM PDT
... RECORD HEAT
REPORTED ACROSS MUCH OF
THE HIGH
TEMPERATURE AT
DEGREES. THIS SETS
THE RECORD FOR THE HIGHEST TEMPERATURE FOR THIS
DATE. THE PREVIOUS
RECORD OF 85 DEGREES WAS SET IN 1973. RECORDS
HAVE BEEN KEPT AT
THIS SITE SINCE 1881.
THE HIGH
TEMPERATURE AT
95 DEGREES. THIS
SETS THE RECORD FOR THE HIGHEST TEMPERATURE FOR
THIS DATE. THE
PREVIOUS RECORD OF 90 DEGREES WAS SET IN 1973.
RECORDS HAVE BEEN
KEPT AT THIS SITE SINCE 1959.
THE HIGH
TEMPERATURE AT EPHRATA IN THE PAST 24 HOURS
WAS 96 DEGREES.
THIS SETS THE RECORD FOR THE HIGHEST TEMPERATURE
FOR THIS DATE. THE
PREVIOUS RECORD OF 92 DEGREES WAS SET IN 1973.
RECORDS HAVE BEEN
KEPT AT THIS SITE SINCE 1948.
THE HIGH
TEMPERATURE AT
WAS 96 DEGREES.
THIS SETS THE RECORD FOR THE HIGHEST TEMPERATURE FOR
THIS DATE. THE
PREVIOUS RECORD OF 87 DEGREES WAS SET IN 1970.
RECORDS HAVE BEEN
KEPT AT THIS SITE SINCE 1947.
THE LOW
TEMPERATURE AT
WAS 58 DEGREES.
THIS SETS THE RECORD FOR THE WARMEST LOW TEMPERATURE
FOR THIS DATE. THE
PREVIOUS RECORD OF 53 DEGREES WAS SET IN 1979.
RECORDS HAVE BEEN
KEPT AT THIS SITE SINCE 1947.
THE HIGH
TEMPERATURE AT
THIS SETS THE
RECORD FOR THE HIGHEST TEMPERATURE FOR THIS DATE. THE
PREVIOUS RECORD OF
85 DEGREES WAS SET IN 1973. RECORDS HAVE BEEN
KEPT AT THIS SITE
SINCE 1940.
THE HIGH
TEMPERATURE AT
DEGREES. THIS SETS
THE RECORD FOR THE HIGHEST TEMPERATURE FOR THIS
DATE. THE PREVIOUS
RECORD OF 91 DEGREES WAS SET IN 1973. RECORDS
HAVE BEEN KEPT AT
THIS SITE SINCE 1881.
000
SXUS76 KOTX 180319
REROTX
RECORD EVENT
REPORT
NATIONAL WEATHER
SERVICE
815 PM PDT
... RECORD HEAT
REPORTED ACROSS MUCH OF
17 MAY 2006 PREV RECORD
EPHRATA 96 93 IN 1973
PULLMAN 92 83 IN 1970
LEWISTON 97 92 IN *1895*
COEUR D`ALENE 91 86 IN 1964
LA CROSSE 96 89 IN 1956
MAZAMA 94 86 IN 1985
NORTHPORT 94 93 IN 1973
WENATCHEE
AIRPORT 96 89 IN 1993
WINTHROP 95 91 IN 1924
COOLEE DAM 92 89 IN 1973
MOSES LAKE 96 89 IN 1956
BONNERS FERRY 90 86 IN 1956
REPUBLIC 92 89 IN 1924
PLAIN 93 89 IN 1956
OMAK 95 88 IN 1932
000
SXUS76 KOTX 200844
REROTX
RECORD EVENT
REPORT
NATIONAL WEATHER
SERVICE
145 AM PDT
...RECORD HEAT
CONTINUED OVER PARTS OF
THE FOLLOWING
TABLE LISTS ALL OF THE RECORD HIGH TEMPERATURES BROKEN
YESTERDAY ACROSS
19 MAY 2006 PREV RECORD
LIBBY DAM BASE (245011)
Extremes
Highest Daily Maximum Temperature (degrees F)
Days: 5/1 - 5/31
Length of period: 1 day
Years: 1986-2006
Rank Value Ending Date
1 97.0
2 93.0
4 92.0
5 91.0
8 90.0
10 89.0
Only periods with no missing data were evaluated.
Last value also occurred in one or more previous years.
LIBBY DAM BASE (245011)
Daily Almanac
Date:
Daily Values
Observed
Max Temperature
90 68 90 in 2006 63
Min Temperature
46 38 27 in 2003 45
Avg Temperature
68.0 53 68.0 in 2006+ 54.0
Precipitation
0.00 0.06 0.32 in 1989 0.00
New Snowfall
0.0 - 0.0 in 2006+ 0.0
Snow Depth
0 - 0 in 2006+ 0
HDD (base 65)
0 12 24 in 2003 11
CDD (base 65)
3 0 3 in 2006+ 0
Month-To-Date
Observed
Avg Max Temperature
66.8 66.2 75.9 in 1998 66.2
Avg Min Temperature
35.3 36.5 32.3 in 1999 36.9
Avg Temperature
51.0 51.4 58.5 in 1987 51.6
Total Precipitation
0.61 0.81 1.60 in 1996 1.45
Total Snowfall
0.0 - 0.0 in 2006 0.0
Avg Snow Depth
0 - 0 in 2005 0
Total HDD 194 233 332 in 1999 226
Total CDD
3 0 18 in 1993 0
LIBBY DAM BASE (245011)
Daily Almanac
Date:
Daily Values
Observed
Max Temperature
89 69 89 in 2006 61
Min Temperature
49 39 29 in 2003 39
Avg Temperature
69.0 54 69.0 in 2006 50.0
Precipitation
0.00 0.06
0.65 in 1998 0.00
New Snowfall
- - 0.0 in 2005+ 0.0
Snow Depth
- - 0 in 2005+ 0
HDD (base 65)
0 11 25 in 2003 15
CDD (base 65)
4 0 4 in 2006 0
Month-To-Date
Observed
Avg Max Temperature
68.3 66.4 74.7 in 1998 65.9
Avg Min Temperature
36.2 36.6 32.9 in 1999 37.0
Avg Temperature
52.2 51.5 58.6 in 1987 51.5
Total Precipitation
0.61 0.87 1.85 in 1996 1.45
Total Snowfall
0.0 - 0.0 in 2006 0.0
Avg Snow Depth
0 - 0 in 2005 0
Total HDD
194 244 344 in 1999 241
Total CDD
7 0 18 in 1993 0
LIBBY DAM BASE (245011)
Daily Almanac
Date:
Daily Values Observed
Max Temperature
93 69 93 in 2006 64
Min Temperature
50 39 31 in 1997 43
Avg Temperature
71.5 54 71.5 in 2006 53.5
Precipitation
0.00 0.06 0.40 in 2005 0.40
New Snowfall
- - 0.0 in 2005+ 0.0
Snow Depth
- - 0 in 2005+ 0
HDD (base 65)
0 11 22 in 2003 11
CDD (base 65)
7 0 7 in 2006 0
Month-To-Date
Observed
Avg Max Temperature
69.8 66.5 75.0 in 1993 65.8
Avg Min Temperature
37.1 36.7 32.9 in 2003 37.3
Avg Temperature
53.4 51.6 58.3 in 1987 51.6
Total Precipitation
0.61 0.93 1.96 in 1996 1.85
Total Snowfall
0.0 - 0.0 in 2006 0.0
Avg Snow Depth
0 - 0 in 2005 0
Total HDD
194 255 355 in 1999 252
Total CDD
14 0 19 in 1993 0
BONNERS FERRY (101079)
Daily Almanac
Date:
Daily Values
Observed
Max Temperature
90 70 90 in 2006 62
Min Temperature
87 42 28 in 1966 49
Avg Temperature
88.5 56 88.5 in 2006 55.5
Precipitation
0.00 0.06 0.75 in 1941 0.05
New Snowfall
0.0 - 0.0 in 2006+ 0.0
Snow Depth
0 - 0 in 2006+ 0
HDD (base 65)
0 9 21 in 1966+ 9
CDD (base 65)
24 0 24 in 2006 0
Month-To-Date
Observed
Avg Max Temperature
67.2 67.6 76.8 in 1998 69.1
Avg Min Temperature
42.3 40.0 33.7 in 1911 43.7
Avg Temperature
54.8 53.9 60.4 in 1998 56.4
Total Precipitation
0.17 0.92 3.76 in 1996 0.98
Total Snowfall
0.0 - 4.4 in 1956 0.0
Avg Snow Depth
0 - 0 in 2005 0
Total HDD
114 190 322 in 1913 142
Total CDD
24 0 24 in 2006 0
(Weekly Summary:
12Z may 1 - 15, 2006)
DIVISION ..MAY TO DAY 15.. ....OCT - MAY....
OBSD DEP PCT AV
OBSD DEP PCT AV
SNAKE RV AB
KOOTENAI 0.50 -0.58
46. 19.51 2.09 112.
olumbia Basin Seasonal Precipitation Division
Averages
(Monthly Summary -
may 2006)
DIVISION ..MAY TO DAY 31.. ....OCT - MAY....
OBSD DEP PCT AV
OBSD DEP PCT AV
SNAKE RV AB
KOOTENAI 2.13 -0.09
96. 21.14 2.58 114.
LIBBY DAM BASE (245011)
Extremes
Highest Daily Precipitation (inches)
Days: 6/1 - 6/30
Length of period: 1 day
Years: 1986-2006
Rank Value Ending Date
1 1.83
2 1.62
3 1.13
4 1.12
5 1.10
6 1.00
7 0.94
8 0.92
10 0.87