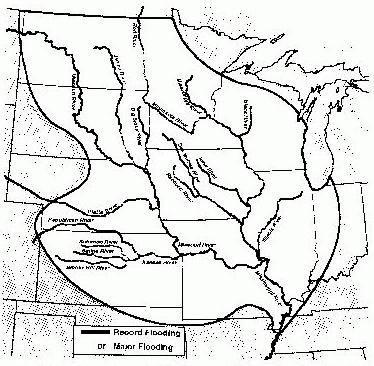
Figure 1. General area impacted by heavy rainfall and/or flooding during "The Great Flood of 1993."
The US Department of Commerce, National Oceanic and Atmospheric Administration, National Weather Service (NWS) now provides hydrologic forecasts (Larson, et.al., 1995 and Fread, et.al., 1995) for the USA through 13 regional river forecast centers (RFCs). Collectively, these centers have the responsibility to provide streamflow forecasts for approximately 4,000 forecast points. Although the NWS has the lead responsibility to provide forecasts for the USA, the forecasts and the resulting water resource and emergency management actions occur through a number of cooperators. These include, other federal agencies, regional river commissions, state and local agencies, the private sector, and universities. A typical scenario for this cooperation is: meteorological and hydrological data are shared among the cooperators; using this data, numerical forecast models are maintained and operated by the RFCs; and, the resulting hydrologic forecasts are then provided by the NWS and used by water resource and emergency managers who in turn take the appropriate responsive actions. The importance of these forecasts is offered by the fact that within the USA, over 75 percent of Presidential natural disaster declarations are a result of flooding.
| TOTAL FLOOD DAMAGES SUFFERED | ||||||||||
|---|---|---|---|---|---|---|---|---|---|---|
| FISCAL YEARS (FY), IN MILLIONS OF $US | ||||||||||
| FY86 | FY87 | FY88 | FY89 | FY90 | FY91 | FY92 | FY93 | FY94 | FY95 | 10 Yr Avg |
| 6,007 | 1,444 | 225 | 1,081 | 1,636 | 1,699 | 763 | 16,370 | 1,120 | 5,111 | 3,546 |
3.1 CASE EXAMPLE 1 - "THE GREAT FLOOD OF 1993"
The hydrometeorological activity leading up to the flooding, which has become known as "The Great Flood of 1993," actually began in the fall of 1992 (NWS, 1994). It is during this time that rains and winter snows produced near saturated soils and above normal water storage conditions. These conditions were followed by meteorological patterns in the spring and summer months of 1993 that were more reminiscent of patterns typically experienced during the late winter and early spring months when storms often follow more northerly tracks. The persistence of the storm systems, along with the broad areal extent of the rainfall and depleted rainfall storage areas from mid-June into August of 1993, produced the flooding. Some areas received more than 1.2 meters of rain during the period.
The duration, extent, and intensity of the flooding uniquely defines this event in the 20th Century. The flood waters remained in many areas for nearly 200 days which is very unusual for this part of the North American continent. Most of the time, people refer to this event as the flood on the Mississippi River in 1993; however, major record flooding occurred along dozens of rivers including the main stems of both the Mississippi and Missouri Rivers. Nine states, more than 15 percent of the contiguous USA, were catastrophically impacted. The impact of social disruption is beyond measure. Experts estimate that more than 50,000 homes were damaged or destroyed and that approximately 54,000 people were evacuated from flooded areas.
Figure 1. General area impacted by heavy rainfall and/or flooding during "The Great Flood of 1993."
As the flood waters persisted during the summer of 1993, the population became physically and emotionally exhausted as they worked together in order to minimize the adverse impacts of the flooding. A semblance of this exhaustion is revealed by some of the questions asked during the flooding:
"When can we get back to our homes?"
"When will drinking water sources become available again?"
"When can we get back to our fields?"
"Why couldn't you have warned us sooner?"
The "Great Flood of 1993" was exceptional due to the combination of several factors:
The antecedent hydrometeorology: the scene was set for flooding across the flood-impacted area long before major flooding actually developed.
The meteorology: the meteorological pattern that caused the excessive rainfall over the region from mid-June into August 1993 was uncommonly persistent.
The magnitude of the flooding: the areal extent of the flooding was unusually large.
The severity of the flooding: major to record flooding occurred along dozens of rivers, including portions of the main stems of both the Mississippi and Missouri Rivers.
The season of the flooding: major flood events in the upper Mississippi River basin typically occur in spring while this occurred throughout the summer.
The duration of the flooding: most significant floods last on the order of days-to-weeks, while this flood lasted on the order of weeks-to-months (150 to 200 days in many locations).
The damage: estimates reveal this as the most costly flood event in the history of the USA.
Flood damages amounted to $15 billion US and 50 flood deaths occurred during the event. Tens of thousands of people were evacuated, some never returned to their homes. At least 10,000 homes were totally destroyed, hundreds of towns were impacted with at least 75 towns totally and completely under flood waters. More than 15 million acres of farmland were inundated. Vice President Gore, at one time during the flooding, had referred to the State of Iowa, as the USA's sixth Great Lake.
3.2 CASE EXAMPLE 2 - TROPICAL STORM ALBERTO
One year after the flooding in the mid-section of the USA, tropical storm Alberto came upon the southeastern portion of the country (NWS, 1995). This storm originated in Senegal on June 18, 1994 as a tropical wave. Two weeks later, on 2 July, the depression strengthened in the Gulf of Mexico to become Tropical Storm Alberto. Fifteen (15) days after the storm's origination, it made landfall near Destin, Florida where winds quickly subsided and Alberto's central pressure rose rapidly.
After landfall, Alberto slowly moved eastward through Alabama into Georgia while precipitation increased. Alberto next came to a standstill just south of Atlanta, Georgia; and, after a few days, Alberto looped back on its previous course before ultimately dissipating. During the event, the NWS Weather Surveillance Radar-1988 Doppler (WSR-88D, with a radius of 230 km) provided NWS forecasters with a very good representation of the areal extent of the precipitation, although it underestimated precipitation amounts somewhat. This rainfall produced record and near-record flooding along the Flint, Ocmulgee, Chattahoochee, Choctawhatchee, and Apalachicola Rivers. Rainfall amounts as high as 536 mm in 24 hours were observed at Americus, Georgia.
Overall, flash flooding and flooding caused by the rainfall from Alberto took 33 lives, destroyed thousands of homes (including some entire communities), forced approximately 50,000 people to be evacuated, and caused property damage (including lost crops) estimated as high as $750 million US. Many of the casualties resulting from this event can be attributed to individual lack of judgment such as:
A factor which may have contributed to this lack of proper reaction is the fact that previous floods in the southeastern USA had not been nearly as severe as this event. Therefore, most residents did not have previous experience in dealing with such a dangerous flood event.
Approximately two-thirds of the flood related fatalities were associated to incidents involving cars and other vehicles. They also represent a small fraction (less than 0.1 percent) of the total number of people evacuated - many lives were saved. Never-the-less, the high loss of life is troubling and clearly leaves room for improvement.
3.3 CASE EXAMPLE 3 - THE WINTER STORM OF 1996
This paper's third case example of flooding is an event which happened in the beginning of 1996 in the northeastern USA. Unlike the first two events being driven primarily by rainfall, this event occurred after an extensive snowfall event. By mid-January of 1996, a succession of snowstorms brought significant and widespread snow accumulation across much of the eastern USA. This brought many activities to a halt, including the movement of traffic on major transportation routes. The extent of the snowfall can be described by an ellipse whose length of 1,800 kilometers extended from Boston, Massachusetts to Memphis, Tennessee; and, whose breadth extended over a reach of approximately 1,000 kilometers. Snow depths of 600 to 900 mm were common from central Pennsylvania across Maryland and West Virginia into Virginia; overall, snow depths averaged 300 mm or more, with significantly higher amounts in the mountains (NWS, to be published).
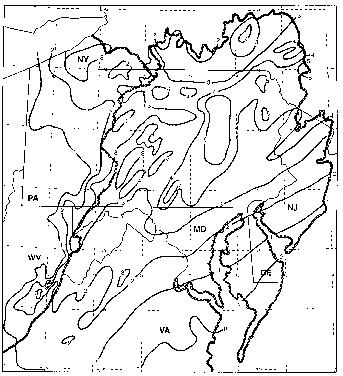
Figure 2. Estimated Water-Equivalent of the Snow Cover on the Morning of January 18, 1996 (units are in inches; from NWS, to be published)
Following this snow accumulation, on 18-19 January 1996, a strong storm system moved through the eastern USA, bringing heavy precipitation, as well as high temperatures, humidity and strong winds. During these two days, the mean areal watershed rainfall varied from 30 mm to slightly over 75 mm, with some individual gages reporting over 110 mm. At most locations, the intense rain lasted only for 6 hours. These heavy rains, combined with significant snowmelt, and in some cases ice jams, led to the production of major flooding in an eight (8) state region - "The Great Flood of 1993" impacted 9 states.
The magnitude of the flooding varied between basins, but it was a major event throughout the area:
Over the region, it was assessed that snowmelt contributed from about 40 mm to over 65 mm of water. This is similar to the amount of rain that was measured during the two days, 18-19 January. However, in much of the region, it was the snowmelt rates that generated the flooding.
In order for the NWS to provide the best service, interagency coordination is on-going between the NWS Weather Forecast Offices (WFOs) and RFCs, with other "need-to-know" agencies (local, state and federal) requiring real-time knowledge and technical expertise in dealing with hydrologic conditions and trends. The public release of these forecasts and outlooks, via the news media, is the responsibility of the WFOs. WFOs are also the public contact point for information and specific explanations of hydrologic events.
As technologies have been advancing and the demands for water availability has been increasing, the public, private and other federal agency sectors are insisting upon the expanded use of coupled National Weather Service (NWS) hydrologic/meteorologic analyses and products for the economic and environmental management of the USA's water resources. To meet this need, the NWS is capitalizing upon its modernization in remote sensing, data automation and advanced hydrologic/hydrometeorologic modeling. The NWS Advanced Hydrologic Prediction System (AHPS) meets this objective and is to be operationally demonstrated beginning with the snowmelt/spring-runoff season of 1997 on the Des Moines River basin, Iowa (Braatz, et.al., 1997). AHPS will provide information regarding the relative uncertainty of hydrologic variables (i.e., river stage and discharge) with lead times out to several weeks and months. Currently, the NWS provides river stage forecasts out to 1, 2, or 3 days. Therefore, AHPS will greatly improve the capability of water facility and emergency managers to take timely and effective actions that will significantly mitigate the impact of major floods and droughts. The system will also provide products to water resource managers and the general public for the sustainable use and enjoyment of water.
Braatz, Dean T., December 1994. "Hydrologic Forecasting for The Great Flood of 1993," Water International, Volume 19, Number 4, International Water Resources Association, Urbana, IL.
Fread, D.L., June 1995. "A Pathway Toward Improving Hydrologic Predications," Iowa Hydraulics Colloquium, Issues and Direction in Hydraulics, IAHR's Journal of Hydraulic Research, Iowa City, IA.
Fread, D.L., R.C. Shedd, G.F. Smith, R. Farnsworth, C.N. Hoffeditz, L.A. Wenzel, S.M. Wiele, J.A. Smith, and G.N. Day, September 1995. "Modernization in the National Weather Service River and Flood Program," Weather and Forecasting, Vol. 10, No. 3, American Meteorological Society, Boston, MA.
Larson, L.W., R.L. Ferral, E.T. Strem, and A.J. Morin, September 1995. "Operational Responsibilities of the National Weather Service River and Flood Program," Weather and Forecasting, Vol. 10, No. 3, American Meteorological Society, Boston, MA.
NWS, February 1994. "The Great Flood of 1993," NOAA Natural Disaster Survey Report, U.S. Department of Commerce, National Oceanic and Atmospheric Administration, National Weather Service, Office of Hydrology, Silver Spring, MD.
NWS, December 1995. "Tropical Storm Alberto Heavy Rains and Flooding Georgia, Alabama, Florida July 1994," NOAA Natural Disaster Survey Report, U.S. Department of Commerce, National Oceanic and Atmospheric Administration, National Weather Service, Office of Hydrology, Silver Spring, MD.
NWS (to be published). "Northeast Floods of January 1996," NOAA Natural Disaster Survey Report, U.S. Department of Commerce, National Oceanic and Atmospheric Administration, National Weather Service, Office of Hydrology, Silver Spring, MD.
Stallings, E.A., and L.A. Wenzel, September 1995. "Organization of the River and Flood Program in the National Weather Service," Weather and Forecasting, Vol. 10, No. 3, American Meteorological Society, Boston, MA.
U.S. Army Corps of Engineers, Engineering Division, October 1996. U.S. Army Corps of Engineers Annual Flood Damage Report to Congress for Fiscal Year 1995, USACE, Washington D.C.