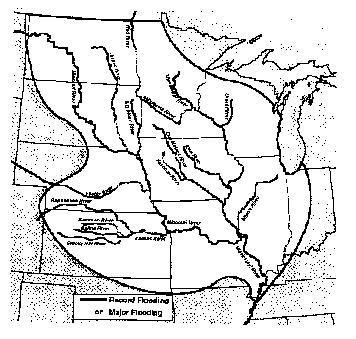
Figure 1. Area Impacted by the 1993 Midwest Flood
Abstract. The 1993 midwest flood was one of the most significant and damaging natural disasters ever to hit the United States. Damages totaled $15 billion, 50 people died, hundreds of levees failed, and thousands of people were evacuated, some for months. The flood was unusual in the magnitude of the crests, the number of record crests, the large area impacted, and the length of the time the flood was an issue.
The paper discusses some details of the flood, the forecasting procedures utilized by the National Weather Service and the precipitation events which caused the flood.
The magnitude and severity of this flood event was simply over-whelming, and it ranks
as one of the greatest natural disasters ever to hit the United States. Approximately 600
river forecast points in the Midwestern United States were above flood stage at the same
time. Nearly 150 major rivers and tributaries were affected. It was certainly the largest and
most significant flood event ever to occur in the United States (Fig. 1).
Figure 1. Area Impacted by the 1993 Midwest Flood
Tens of thousands of people were evacuated, some never to return to their homes. At least 10,000 homes were totally destroyed, hundreds of towns were impacted with at least 75 towns totally and completely under flood waters. At least 15 million acres of farmland were inundated, some of which may not be useable for years to come.
Transportation was severely impacted. Barge traffic on the Missouri and Mississippi Rivers was stopped for nearly 2 months. Bridges were out or not accessible on the Mississippi River from Davenport, Iowa, downstream to St. Louis, Missouri. On the Missouri River, bridges were out from Kansas City, downstream to St. Charles, Missouri. Numerous interstate highways and other roads were closed. Ten commercial airports were flooded. All railroad traffic in the Midwest was halted. Numerous sewage treatment and water treatment plants were destroyed (Larson, 1993).
Forecasting Models
The soil moisture model in primary use was the Antecedent Precipitation Index (API) model.
API models have been used in most National Weather Service (NWS) River Forecast Centers
(RFC) to produce flood crest forecasts since the 1940s (Fig.2). Hydrologists at NWS RFCs
developed API procedures based on historical storm events. A given API value at the
beginning of a rain event is typically related to the week of the year, the storm duration, and
the amount of actual rainfall from the event. The API model used during The Great Flood
of 1993 computes a daily index of soil moisture, considers additional rainfall, and computes
any possible runoff.
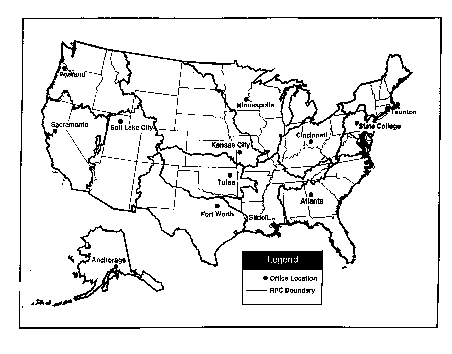
Figure 2. Boundaries of National Weather Service RFCs
Various components are involved in the preparation of flood forecasts. Precipitation and temperature data are input into a snow model. This model determines whether the precipitation is rain or snow based on temperature input. The output from the snow model plus rain becomes input for the soil moisture model. Because of its empirical nature and physical limitations, the API model has a relatively short memory. The assumption is that during periods of no precipitation, soil moisture decreases logarithmically. Another limitation is that baseflow is not addressed directly. However, the model's ease of operation lends itself to quick operational adjustments. This feature allows hydrologists to make timely decisions in balancing the observed physical response with model computed results.
Runoff from the soil moisture model becomes input for the flow model. The "unit hydrograph" technique is employed here. The unit hydrograph is an empirical normalization that represents 1 inch of runoff from rain falling uniformly over a specific basin for a given time step. Constant physical characteristics across the basin and similar hydrograph shapes from storms with uniform rainfall patterns are assumed. A unit hydrograph, to be used in conjunction with an event API model, is best derived from a single rainfall event when all surface runoff occurs in a given time period, e.g., 6 hours. Operationally, the runoff time step is 6 hours. This time step lends itself to data availability, i.e., 6-hourly synoptic precipitation reports.
A storm hydrograph is determined by combining 6-hour incremental runoff values. While model computations are based on flow volumes, most river observations are only available as river stages. In addition, river stages are far easier for the public to comprehend. Therefore, a conversion between discharge and stage is necessary. This relation varies for each location and is affected by many factors. The rating curve is a relation between stage and discharge at a particular location and must be routinely updated. The above procedure produces a hydrograph for a headwater basin. In a continuous simulation model, all upstream flows at a given point, whether they are floodwaves or not, must be continuously routed to a downstream point. It is essential that this routed or predicted flow be accurate for the forecasting of flows at locations downriver. RFC's use a variety of routing techniques including dynamic routing, Tatum and Muskingum methods (Braatz, 1991).
Precipitation
During June through August 1993, rainfall totals surpassed 12 inches across the eastern Dakotas, southern Minnesota, eastern Nebraska, Wisconsin, Kansas, Iowa, Missouri, Illinois, and Indiana. More than 24 inches of rain fell on central and northeastern Kansas, northern and central Missouri, most of Iowa, southern Minnesota, and southeastern Nebraska, with up to 38.4 inches in east-central Iowa. These amounts were approximately 200-350 percent of normal from the northern plains southeastward into the central United States. From April 1 through August 31, precipitation amounts approached 48 inches in east-central Iowa, easily surpassing the area's normal annual precipitation of 30-36 inches.
A critical factor affecting the record flooding was the near continuous nature of the rainfall. Many locations in the nine-state area experienced rain on 20 days or more in July, compared to an average of 8-9 days with rain. There was measurable rain in parts of the upper Mississippi basin on every day between late June and late July. The persistent, rain-producing weather pattern in the Upper Midwest, often typical in the spring but not summer, sustained the almost daily development of rainfall during much of the summer.
The Great Flood of 1993 had been set by June 1 with saturated soils and streams filled
to capacity across the Upper Midwest. Runoff from the ensuing persistent heavy rains of
June, July, and August had no place to go other than into the streams and river channels.
Record summer rainfalls with amounts achieving 75- to 300-year frequencies thus produced
record flooding on the two major rivers, equaling or exceeding flood recurrence intervals of
100 years along major portions of the upper Mississippi and lower Missouri Rivers (Fig.3)
(Stallings, 1994).
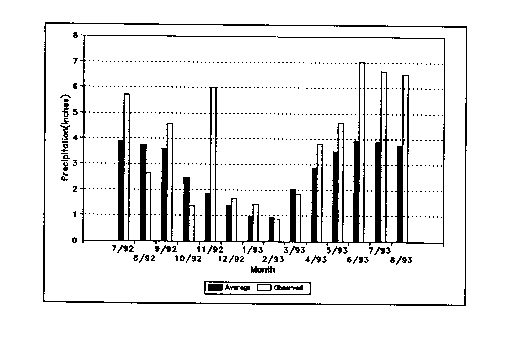
Figure 3. Comparison of Average and Observed Monthly Precipitation Totals for the Upper Mississippi River Basin
In early July, Iowa was hit with numerous record rainfalls. Storm totals of up to 8 inches were again common. Record flooding occurred on the Skunk, Iowa, and Des Moines Rivers. The city of Des Moines, Iowa, was particularly hard hit by flooding on July 9th. The flow from these rivers combined with already near-record flows on the Mississippi River to push the stage at St. Louis up to a new record high stage of 47 feet on July 20th.
In mid to late July, heavy rains began further west in North Dakota, Nebraska, Kansas,
and Missouri. Record flooding began on rivers in Missouri, Nebraska, Kansas, North
Dakota, and South Dakota. The Missouri River crested at 48.9 feet at Kansas City on July
27th breaking the previous record crest, set in 1951, by 2.7 feet. This crest pushed on down
the Missouri River setting new records at Boonville, Jefferson City, Hermann, St. Charles,
and other locations. This record flow joined the already full Mississippi River just north of
St. Louis, and pushed the Mississippi to another record crest of 49.47 feet at St. Louis on
August 1st (Parrett, 1993) (Fig. 4). In all, 92 locations set new record crests during the
Great Flood of 1993. A few of those locations are shown in Table 1.
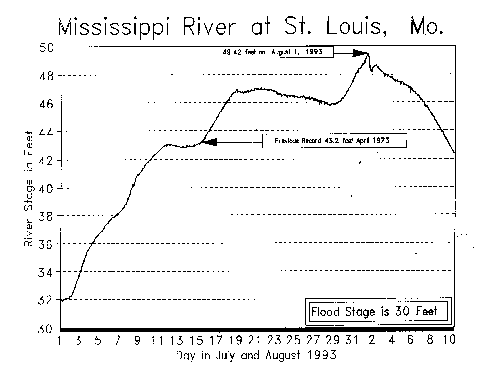
Figure 4. Hydrograph of Mississippi River at St. Louis
Table 1.  Locations with New Record Stages in the Mississippi River Basin

LOCATION                  FLOOD     OLD RECORD      NEW RECORD
                          STAGE    Stage  Date     Stage  Date
                          (ft.)    (ft.)           (ft.)
Mississippi R
  Quad Cities L/D15       15       22.5   650428   22.6   930709
  Muscatine IA            16       24.8   650429   25.6   930709
  Keithsburg IL           13       20.4   650427   24.2   930709
  Burlington, IA          15       21.5   730425   25.1   930710
  Keokuk L/D16 IA         16       23.4   730424   27.2   930710
  Gregory Landing MO      15       24.6   730424   26.4   930707
  Quincy IL               17       28.9   730423   32.2   930713
  Hannibal MO             16       28.6   730425   31.8   930716
  Louisiana MO            15       27.0   730424   28.4   930728
  Clarksville MO L/D24    25       36.4   730424   37.7   930729
  Winfield MO L/D25       26       36.8   730427   39.6   930801
  Grafton IL              18       33.1   730428   38.2   930801
  Melvin Price IL         21       36.7   730428   42.7   930801
  St Louis MO             30       43.2   730428   49.6   930801
  Chester IL              27       43.3   730430   49.7   930807

Missouri R
  Plattsmouth NE          26       34.7   840614   35.7   930725
  Brownville NE           32       41.2   840615   44.3   930724
  St. Joseph MO           17       26.8   520422   32.7   930726
  Kansas City MO          32       46.2   510714   48.9   930728
  Napoleon MO             17       26.8   510715   27.8   930727
  Lexington MO            22       33.3   510715   33.4   930708
  Waverly MO              20       29.2   840623   31.2   930728
  Miami MO                18       29.0   510716   32.4   930729
  Glasgow MO              25       36.7   510718   39.6   930729
  Boonville MO            21       32.8   510717   37.1   930729
  Jefferson City MO       23       34.2   510718   38.6   930730
  Gasconade MO            22       38.7   861005   39.6   930731
  Hermann MO              21       35.8   561005   36.3   930731
  St. Charles MO          25       37.5   861007   39.5   930801
The Great Flood of 1993 was unusual in other respects. It was wide spread covering
nine states and 400,000 square miles. Fifty deaths occurred as a result of the flood. Over
1,000 levees were topped or failed as shown in Table 2. Also, the flood was of extremely
long duration lasting at some locations for nearly 200 days as shown in Table 3.
Table 2.  Levee Failures During the Midwest Flood of 1993

CORPS OF ENGINEERS       NUMBER OF FAILED OR OVERTOPPED LEVEES
     DISTRICT                 Federal        Non-Federal

St. Paul                      1 of 32        2 of 93
Rock Island                   12 of 73       19 of 185
St. Louis                     12 of 42       39 of 47
Kansas City                   6 of 48        810 of 810
Omaha                         9 of 31        173 of 210
Totals                        40 of 226      1043 of 1345


Table 3.  Duration of Flooding, 1993

                    FS    DATES, NUMBER OF DAYS           TOTAL
                                                          # DAYS
MISSOURI RIVER
  JEFFERSON CITY    23    7/2--8/19,49  9/22-10/4,13      62
  HERMANN           21    7/2--8/25,55  9/14-10/5,22      77
  ST. CHARLES       25    7/3--8/30,95  9/3--10/7,35      94

MISSISSIPPI RIVER
  QUINCY            17    4/2--5/26,55  6/9---9/13, 97    152
  HANNIBAL          16    4/1-----------------9/21,174    174
  LOUISIANA         15    4/2----------------10/4 ,186    186
  D24 CLARKSVILLE   25    4/2----------------10/5 ,187    187
  D25 WINFIELD      26    4/3--6/2 ,61  6/7--10/6 ,122    183
  GRAFTON           18    3/26-6/2 ,69  6/7--10/10,126    195
  MELVIN PRICE TW   21    4/3--5/28,56  6/8--10/8 ,123    179
  ST. LOUIS         30    4/11-5/24,44  6/27--9/13,79
                              9/15-10/7,23                146
  CHESTER           27    4/3--5/31,59  6/8--10/12,127    186
  CAPE GIRARDEAU    32    4/3--5/28,56  6/10-10/12,125    181
  THEBES            33    4/4--5/26,53  6/29-10/11,105    158
Finally, it should be recognized that this flood event was so big, it simply overwhelmed everyone and everything. As Mark Twain said a hundred years ago, the Mississippi River "cannot be tamed, curbed or confined.....you cannot bar its path with an obstruction which it will not tear down, dance over and laugh at."
Josephson, D.H. (1994). "The Great Midwest Flood of 1993," Natural Disaster Survey Report, Department of Commerce, NOAA, National Weather Service, Silver Spring, Maryland.
Larson, L.W. (1993). "The Great Midwest Flood of 1993," Natural Disaster Survey Report, National Weather Service, Kansas City, Missouri.
Parrett, Charles, Melcher, N.B. and James, R.W. (1993). "Flood Discharges in the Upper Mississippi River Basin," in Floods in the Upper Mississippi River Basin, U.S. Geological Survey Circular 1120-A.
Stallings, E.A. (1994). "Hydrometeorlogical Analysis of the Great Flood of 1993," Department of Commerce, NOAA, National Weather Service, Silver Spring, Maryland.