Description of the Hydrologic Cycle
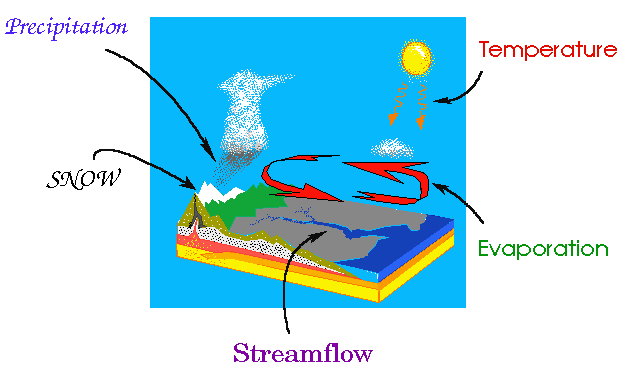
This is an education module about the movement of water on the planet Earth. The module includes a discussion of water movement in the United States, and it also provides specific information about water movement in Oregon.
The scientific discipline in the field of physical geography that deals with the water cycle is called hydrology. It is concerned with the origin, distribution, and properties of water on the globe. Consequently, the water cycle is also called the hydrologic cycle in many scientific textbooks and educational materials. Most people have heard of the science of meteorology and many also know about the science of oceanography because of the exposure that each discipline has had on television. People watch TV weather personalities nearly every day. Celebrities such as Jacques Cousteau have helped to make oceanography a commonly recognized science. In a broad context, the sciences of meteorology and oceanography describe parts of a series of global physical processes involving water that are also major components of the science of hydrology. Geologists describe another part of the physical processes by addressing groundwater movement within the planet's subterranean features. Hydrologists are interested in obtaining measurable information and knowledge about the water cycle. Also important is the measurement of the amount of water involved in the transitional stages that occur as the water moves from one process within the cycle to other processes. Hydrology, therefore, is a broad science that utilizes information from a wide range of other sciences and integrates them to quantify the movement of water. The fundamental tools of hydrology are based in supporting scientific techniques that originated in mathematics, physics, engineering, chemistry, geology, and biology. Consequently, hydrology uses developed concepts from the sciences of meteorology, climatology, oceanography, geography, geology, glaciology, limnology (lakes), ecology, biology, agronomy, forestry, and other sciences that specialize in other aspects of the physical, chemical or biological environment. Hydrology, therefore, is one of the interdisciplinary sciences that is the basis for water resources development and water resources management.
The global water cycle can be described with nine major physical processes which form a continuum of water movement. Complex pathways include the passage of water from the gaseous envelope around the planet called the atmosphere, through the bodies of water on the surface of earth such as the oceans, glaciers and lakes, and at the same time (or more slowly) passing through the soil and rock layers underground. Later, the water is returned to the atmosphere. A fundamental characteristic of the hydrologic cycle is that it has no beginning an it has no end. It can be studied by starting at any of the following processes: evaporation, condensation, precipitation, interception, infiltration, percolation, transpiration, runoff, and storage.
The information presented below is a greatly simplified description of the major contributing physical processes. They include:
EVAPORATION
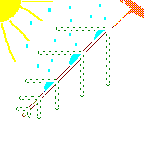
Evaporation occurs when the physical state of water is changed from a liquid state to a gaseous state. A considerable amount of heat, about 600 calories of energy for each gram of water, is exchanged during the change of state. Typically, solar radiation and other factors such as air temperature, vapor pressure, wind, and atmospheric pressure affect the amount of natural evaporation that takes place in any geographic area. Evaporation can occur on raindrops, and on free water surfaces such as seas and lakes. It can even occur from water settled on vegetation, soil, rocks and snow. There is also evaporation caused by human activities. Heated buildings experience evaporation of water settled on its surfaces. Evaporated moisture is lifted into the atmosphere from the ocean, land surfaces, and water bodies as water vapor. Some vapor always exists in the atmosphere.
CONDENSATION

Condensation is the process by which water vapor changes it's physical state from a vapor, most commonly, to a liquid. Water vapor condenses onto small airborne particles to form dew, fog, or clouds. The most active particles that form clouds are sea salts, atmospheric ions caused by lightning,and combustion products containing sulfurous and nitrous acids. Condensation is brought about by cooling of the air or by increasing the amount of vapor in the air to its saturation point. When water vapor condenses back into a liquid state, the same large amount of heat ( 600 calories of energy per gram) that was needed to make it a vapor is released to the environment.
PRECIPITATION

Precipitation is the process that occurs when any and all forms of water particles fall from the atmosphere and reach the ground. There are two sub-processes that cause clouds to release precipitation, the coalescence process and the ice-crystal process. As water drops reach a critical size, the drop is exposed to gravity and frictional drag. A falling drop leaves a turbulent wake behind which allows smaller drops to fall faster and to be overtaken to join and combine with the lead drop. The other sub-process that can occur is the ice-crystal formation process. It occurs when ice develops in cold clouds or in cloud formations high in the atmosphere where freezing temperatures occur. When nearby water droplets approach the crystals some droplets evaporate and condense on the crystals. The crystals grow to a critical size and drop as snow or ice pellets. Sometimes, as the pellets fall through lower elevation air, they melt and change into raindrops.
Precipitated water may fall into a waterbody or it may fall onto land. It is then dispersed several ways. The water can adhere to objects on or near the planet surface or it can be carried over and through the land into stream channels, or it may penetrate into the soil, or it may be intercepted by plants.
When rainfall is small and infrequent, a high percentage of precipitation is returned to the atmosphere by evaporation.
The portion of precipitation that appears in surface streams is called runoff. Runoff may consist of component contributions from such sources as surface runoff, subsurface runoff, or ground water runoff. Surface runoff travels over the ground surface and through surface channels to leave a catchment area called a drainage basin or watershed. The portion of the surface runoff that flows over the land surface towards the stream channels is called overland flow. The total runoff confined in the stream channels is called the streamflow.
INTERCEPTION
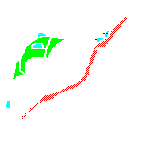
Interception is the process of interrupting the movement of water in the chain of transportation events leading to streams. The interception can take place by vegetal cover or depression storage in puddles and in land formations such as rills and furrows.
When rain first begins, the water striking leaves and other organic materials spreads over the surfaces in a thin layer or it collects at points or edges. When the maximum surface storage capability on the surface of the material is exceeded, the material stores additional water in growing drops along its edges. Eventually the weight of the drops exceed the surface tension and water falls to the ground. Wind and the impact of rain drops can also release the water from the organic material. The water layer on organic surfaces and the drops of water along the edges are also freely exposed to evaporation.
Additionally, interception of water on the ground surface during freezing and sub-freezing conditions can be substantial. The interception of falling snow and ice on vegetation also occurs. The highest level of interception occurs when it snows on conifer forests and hardwood forests that have not yet lost their leaves.
INFILTRATION
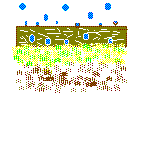
Infiltration is the physical process involving movement of water through the boundary area where the atmosphere interfaces with the soil. The surface phenomenon is governed by soil surface conditions. Water transfer is related to the porosity of the soil and the permeability of the soil profile. Typically, the infiltration rate depends on the puddling of the water at the soil surface by the impact of raindrops, the texture and structure of the soil, the initial soil moisture content, the decreasing water concentration as the water moves deeper into the soil filling of the pores in the soil matrices, changes in the soil composition, and to the swelling of the wetted soils that in turn close cracks in the soil.
Water that is infiltrated and stored in the soil can also become the water that later is evapotranspired or becomes subsurface runoff.
PERCOLATION
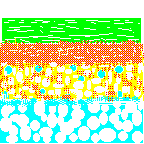
Percolation is the movement of water though the soil, and it's layers, by gravity and capillary forces. The prime moving force of groundwater is gravity. Water that is in the zone of aeration where air exists is called vadose water. Water that is in the zone of saturation is called groundwater. For all practical purposes, all groundwater originates as surface water. Once underground, the water is moved by gravity. The boundary that separates the vadose and the saturation zones is called the water table. Usually the direction of water movement is changed from downward and a horizontal component to the movement is added that is based on the geologic boundary conditions.
Geologic formations in the earth's crust serve as natural subterranean reservoirs for storing water. Others can also serve as conduits for the movement of water. Essentially, all groundwater is in motion. Some of it, however, moves extremely slowly. A geologic formation which transmits water from one location to another in sufficient quantity for economic development is called an aquifer. The movement of water is possible because of the voids or pores in the geologic formations. Some formations conduct water back to the ground surface. A spring is a place where the water table reaches the ground surface. Stream channels can be in contact with an unconfined aquifer that approach the ground surface. Water may move from the ground into the stream, or visa versa, depending on the relative water level. Groundwater discharges into a stream forms the base flow of the stream during dry periods, especially during droughts. An influent stream supplies water to an aquifer while and effluent stream receives water from the aquifer.
TRANSPIRATION
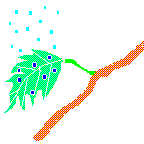
Transpiration is the biological process that occurs mostly in the day. Water inside of plants is transferred from the plant to the atmosphere as water vapor through numerous individual leave openings. Plants transpire to move nutrients to the upper portion of the plants and to cool the leaves exposed to the sun. Leaves undergoing rapid transpiration can be significantly cooler than the surrounding air. Transpiration is greatly affected by the species of plants that are in the soil and it is strongly affected by the amount of light to which the plants are exposed. Water can be transpired freely by plants until a water deficit develops in the plant and it water-releasing cells (stomata) begin to close. Transpiration then continues at a must slower rate. Only a small portion of the water that plants absorb are retained in the plants.
Vegetation generally retards evaporation from the soil. Vegetation that is shading the soil, reduces the wind velocity. Also, releasing water vapor to the atmosphere reduces the amount of direct evaporation from the soil or from snow or ice cover. The absorption of water into plant roots, along with interception that occurs on plant surfaces offsets the general effects that vegetation has in retarding evaporation from the soil. The forest vegetation tends to have more moisture than the soil beneath the trees.
RUNOFF
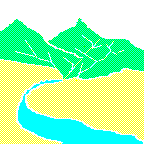
Runoff is flow from a drainage basin or watershed that appears in surface streams. It generally consists of the flow that is unaffected by artificial diversions, storages or other works that society might have on or in a stream channel. The flow is made up partly of precipitation that falls directly on the stream , surface runoff that flows over the land surface and through channels, subsurface runoff that infiltrates the surface soils and moves laterally towards the stream, and groundwater runoff from deep percolation through the soil horizons. Part of the subsurface flow enters the stream quickly, while the remaining portion may take a longer period before joining the water in the stream. When each of the component flows enter the stream, they form the total runoff. The total runoff in the stream channels is called streamflow and it is generally regarded as direct runoff or base flow.
STORAGE
There are three basic locations of water storage that occur in the planetary water cycle. Water is stored in the atmosphere; water is stored on the surface of the earth, and water stored in the ground.
Water stored in the atmosphere can be moved relatively quickly from one part of the planet to another part of the planet. The type of storage that occurs on the land surface and under the ground largely depend on the geologic features related to the types of soil and the types of rocks present at the storage locations. Storage occurs as surface storage in oceans, lakes, reservoirs, and glaciers; underground storage occurs in the soil, in aquifers, and in the crevices of rock formations.
The movement of water through the eight other major physical processes of the water cycle can be erratic. On average, water the atmosphere is renewed every 16 days. Soil moisture is replaced about every year. Globally, waters in wetlands are replaced about every 5 years while the residence time of lake water is about 17 years. In areas of low development by society, groundwater renewal can exceed 1,400 years. The uneven distribution and movement of water over time, and the spatial distribution of water in both geographic and geologic areas, can cause extreme phenomena such as floods and droughts to occur.
ESTIMATED
GLOBAL WATER CYCLETYPE OF LOCATION VOLUME PERCENT OF TOTAL
WATER millions of millions of VOLUME
cu. miles cu kilometer
SALT WATER 97.00
oceans 314.2 1308.0 (96.4%)
saline bodies 2.1 8.7 (0.6%)
FRESH WATER 2.90
ice & snow 6.9 28.7 (2.1%)
lakes 0.5 2.1 (0.15%)
rivers 0.01 0.04 (0.003%)
accessible
groundwater 1.0 4.2 (0.31%)
ATMOSPHERIC 0.10
sea
evaporation 0.1 0.42 (0.03%)
land
evaporation 0.05 0.21 (0.015%)
precipitation
over sea 0.09 0.37 (0.03%)
precipitation
over land 0.03 0.12 (0.01%)
water vapor 0.005 0.02 (0.002%)
ROUNDED TOTAL 326.00 1357.00 100.0
If a fifty-five gallon drum of water represented the total supply of water on the planet then:
a) the oceans would be represented by 53 gallons, 1 quart, 1 pint and 12 ounces;
b) the icecaps and glaciers would represent 1 gallon, and 12 ounces;
c) the atmosphere would contribute 1 pint and 4.5 ounces;
d) groundwater would add up to 1 quart, and 11.4 ounces;
e) freshwater lakes would represent one half ounce;
f) inland seas and saline lakes would add up to over one third of an ounce;
g) soil moisture and valdose water would total to about one fourth of an ounce;
h) the rivers of the world would only add up to one-hundredth of an ounce (less than one one-millionth of the water on the planet).
WATER BUDGET IN THE UNITED STATES
The atmosphere above the 48 coterminous United States of America stores about 36.5 cubic miles per day of atmospheric water. A little over 10 percent or 3.9 cubic miles of it falls as precipitation each day. About 1,430 cubic miles of precipitation fall over the 48 states annually. This volume would be enough each year to cover the states with about 30 inches of water.
The greatest average yearly precipitation in the world of 460 inches (1,168 cm) occurs at Mt. Waialeale, Hawaii. The lowest average annual precipitation of 1.63 inches ( 4.1 cm) in the United States occurred over a 42-year period in Death Valley, California. The longest dry period with no precipitation in the United States occurred during a 767 day period from October 3, 1912 to November 8, 1914 at Bagdad, California.
An average of 70 percent of the annual precipitation to the coterminous U.S. ( 1,001 cubic miles) evaporates back into the atmosphere from land and water surfaces and by transpiration from vegetation. The remaining 30 percent of the annual precipitation ( 429 cubic miles) is transported through the other surface and subterranean processes of the water cycle to a stream, lake, or ocean.
Groundwater storage in the coterminous United States has been estimated to be about 15,100 cubic miles both in the shallow groundwater (less than 2,600 feet deep) and an equal amount in the groundwater deeper than 2,600 feet. Soil moisture in the top 3 feet of soil is estimated to be equivalent to about 150 cubic miles of water.
The United States has approximately 4,560 cubic miles of water stored in freshwater lakes. Although there are about 5,540 cubic miles of water are stored in the Great Lakes alone, over 50 percent of the volume is considered to be in the United States. Also, about 14 cubic miles are stored in salt lakes of the nation. In addition, there is approximately 12 cubic miles of surface waters stored in stream channels in route to the oceans. Other sources of surface storage in the coterminous states include 16 cubic miles of frozen water in glaciers.
The stream flow volume that reach the oceans of the nation is about 1.12 cubic miles per day ( 409 cubic miles per year). The total combined surface and groundwater flow to the nation's oceans is 1.18 cubic miles per day. The Mississippi River alone contributes 0.34 cubic miles per day (annual natural runoff of 593,000 cubic feet per second).
There are approximately 2700 reservoirs and controlled natural lakes of more than 5,000 acre-feet in storage in the United States. The reservoirs provide 142 cubic miles of storage, almost 90% of which occurs in 600 of the largest reservoirs. Also, there are approximately 50,000 reservoirs ranging from 50 to 5,000 acre-feet in storage. It is also estimated that there are about 2 million farm ponds in the United States. Most of the major reservoirs in the nation are owned by the public. The Bureau of Land Management is the manager of the most federal dams (over 750), but most are small dams. The larger reservoirs are managed by the U.S. Army Corps of Engineers, the Bureau of Reclamation, and the Tennessee Valley Authority. The Corps has built and operates almost 600 dams and reservoirs ,the Bureau of Reclamation operates nearly 300 dams and reservoirs, and the TVA has over 50 dams and reservoirs. Other federal agencies that manage small dams include the US Forest Service with about 400, the Bureau of Indian Affairs with over 300, the National Park Service with over 260, the US Fish and Wildlife Service with over 175, and the Department of Energy with about 30 dams.
WATER IN THE STATE OF OREGON
Oregon is divided into two distinct rainfall zones by the Cascade Range. The annual precipitation west of the Cascade Mountains ranges from 40 to 140 inches. East of the Cascades, precipitation ranges from 10 to 20 inches per year. The average annual precipitation for the entire state is 28 inches. The average annual runoff is about 20 inches. The state has a network of 112,000 miles of rivers and streams to accommodated the annual runoff. There are over 365 waterfalls mapped in Oregon that are in the cascade and the cataract categories of waterfalls. Cascade waterfalls have small volumes of water with perpendicular movement of the flowing water often associated in a succession of stages. Cataract category waterfalls have large volumes of water that move perpendicularly. Over 120 geothermal hot springs in the state have been identified with water temperatures that are 15 degrees F above the mean annual air temperature. The total groundwater supply in Oregon has not been quantified.
Oregon has an estimated available, annual surface water supply of over 66 million acre-feet (19.5 cubic miles). Differences in the seasonal and geographic distribution of water resources throughout the state results in annual water shortages in many areas of the state, especially in eastern Oregon. Use of natural flow of surface waters, surface storage in reservoirs, and ground water supplies from aquifers are used to meet the year around demands.
The major river affecting Oregon is the 1,243 mile long Columbia River. It forms much of Oregon's northern border with the state of Washington. One of the Columbia's major tributaries, the Snake River forms a major portion of the eastern border of Oregon with Idaho and is the location of the 7,900 feet deep Hell's Canyon. The Columbia River originates in adjacent states of Washington, Idaho, and Montana and in Canada. The average annual flow is 265,000 cubic feet per second. This volume represents 0.15 cubic miles per day.
Other major watersheds in Oregon can be divided into 20 additional basins. They include:
        North Coast Drainages                   Malheur
        Willamette                              Owyhee
        Sandy                                   Malheur Lake*
        Deschutes                               Klamath
        John Day                                Chetco
        Umatilla                                Rogue
        Grande Ronde                            South Coast Drainages
        Powder                                  Umpqua
        Snake                                   Mid-Coast Drainages
There are seven watersheds that empty into the Pacific Ocean. Two of the basins (*) are closed basin and do not discharge water to the ocean or to receiving streams. Eleven are interior basins that empty into receiving streams.
Oregon abounds with over 6,000 natural lakes, ponds, marshes, sloughs and reservoirs. Over 1,400 of them are named lakes. They have a combined surface area of 500,000 acres (781 square miles). Hundreds of the lakes are unnamed. There are 13 Lost Lakes, 11 Blue Lakes, 10 Clear Lakes and 10 Fish Lakes. They range in surface area size from a maximum of 90,000 acres (141 square miles) at Upper Klamath Lake to cattle pond, farm ponds, and mill ponds of less than one acre. Crater Lake is the deepest lake in the United States. It is 1,932 feet deep, with a capacity of 14 million acre-feet (4.14 cubic miles) and a surface area of 13,139 acres (20.5 square miles). Following heavy rainfall and runoff during in 1984, Malheur and Harney lakes in southeastern Oregon were joined together for several years. Malheur Lake and Harney Lake are again separate lakes, but connected as part of a closed basin wetland system, with Malheur Lake being about 90,000 acres. The Malheur Lake complex is still considered the largest natural body of water in Oregon. The 180,000 acres (281 square miles) of the lake/wetland complex located in the closed basin forms the largest freshwater marsh in the western contiguous United States. Other large lakes in Oregon include Waldo, Odell, and Wallowa lakes. More than half of the lakes in the state are volcanic or glacial depressions located on the high elevation areas between the summits of the Cascade Range. Nearly 100 of the natural lakes are clustered in the Wallowa Mountains of northeastern Oregon. Many other lakes are located between sand dunes near the Oregon shore. Many of the natural lakes throughout the state have had water control structures built at their outlets to enhance storage in the lakes and to control the release of stored water for downstream irrigation.
Oregon has more than 60 reservoirs with capacities of over 5,000 acre-feet each. The largest reservoir in the state is the Bureau of Reclamation's Owyhee Lake in southeastern Oregon with over 1 million acre-feet ( 0.3 cubic miles) of storage. Most of the reservoirs in Oregon were built, at least partially, to store irrigation water. There are hundreds of small single purpose reservoirs built by local irrigation companies. Rarer types of single purpose reservoirs include recreation reservoirs, fish and wildlife reservoirs, and water quality enhancement reservoirs.
Reservoirs are generally characterized by their project purposes. Water supply reservoirs are distinguished by large storage volumes that are capable of providing an expected annual supply of water and capable of outlasting most droughts. Irrigation reservoirs have large conservation pools with maximum conservation pools at the beginning of the growing season and a minimum pool during the nongrowing season. Flood control reservoirs have a small permanent pools with a large storage capacities to reduce downstream water levels key locations on rivers. Another characteristic of flood control reservoirs is that they are generally drawndown as quickly as possible following a high runoff event to reestablish their storage capabilities. A hydroelectric reservoir is characterized by storage and release properties that meet regional energy demands, especially during the winter or the summer. Re-regulation reservoirs are built below hydroelectric dams to stabilize water flow in rivers to reduce flow fluctuations between daily power generation periods. Headwater storage reservoirs for navigation purposes have large storage pools at the beginning of the dry season and they release enough water to support seasonal navigation traffic. Lock and dam reservoirs, however, support waterborne navigation by creating slightly vary pools that extends upstream a considerable distance from the run-of-river projects.
US Army Corps of Engineers reservoirs are multiple purpose impoundments meeting several types of water resources needs such as flood control, hydroelectric power generation, navigation, irrigation, municipal and industrial water supply, water quality, fisheries, and recreation. The Portland District, Corps of Engineers built and operates three run-of-river reservoirs on the main stem of the lower Columbia River, Bonneville, The Dalles, and John Day dams, that meet navigation, hydroelectric power, irrigation, fisheries, water quality and recreation needs. The Portland District also has built and operates 13 multiple purpose storage projects with a total capacity of 2,308,020 acre-feet of water at maximum conservation pool ( 0.68 cubic mile) in the Willamette River Basin. The district also stores 547,191 acre-feet of water (0.16 cubic mile) at the maximum pools of the two Rogue River Basin projects. Additionally, John Day Dam, on the Columbia River, has 534,000 acre-feet (0.16 cubic miles) of usable storage. Portland District's Willow Creek Dam, on the north central Oregon tributary to the Columbia River, stores 6,249 acre-feet (0.002 cubic miles) at it's normal summer conservation pool level. Therefore, the total volume of water stored in Portland District reservoirs is equivalent to over 75 percent of the single daily flow of water from U.S. rivers into the oceans.
The scheduling of water storage and release from dams is part of a water resources engineering function called reservoir regulation.
Provided by Corps of Engineers - Portland District
|


