Description of Peakflow Forecasts Formulation
Process
- The forecasts are produced using a simulating system which includes both hydrologic and hydraulic models to simulate snow, streamflow and reservoir conditions. An added component of this system is the Ensemble Prediction System (ESP). ESP simulations assume current modeled conditions and then apply 50+ years of historical meteorological forcings sets of temperature and precipitations to generate future hydrolgic traces. The forcings used, represent the possible statistical characteristics of future conditions. The resulting ensembles are then analyzed to determine the statistical distribution of certain parameters. For peakflows, it is the maximum discharge to occurring over a specified period (hour, day, week, etc.). Peakflow predictions present on this page use statistics based one day.
Peakflow forecasts are limited to four months into the future.
Available Products: |
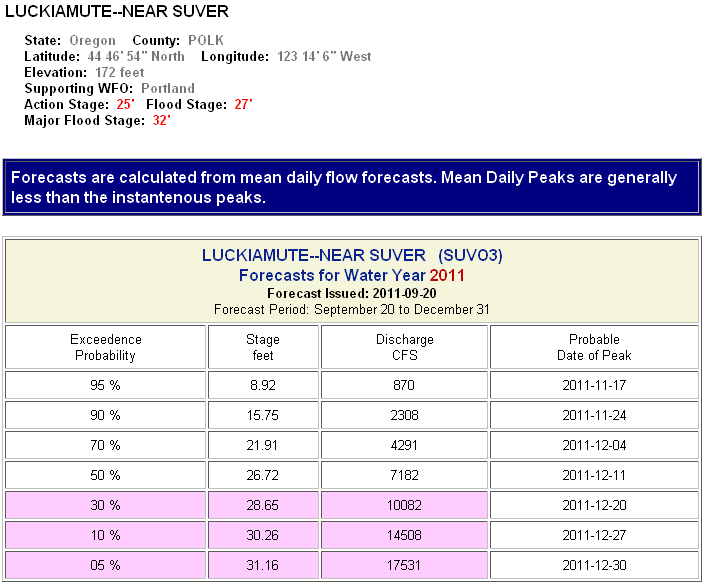
Table 1:
Peakflow Exceedance Table. This table is a statistical summary of all the ensembles produced by the ESP procedure. The probability of exceedence is the chance of a particular stage and/or discharge being exceeded in the 4 month forecast period. The probable date of peak is the most likely date of reaching the peak for a specific probability level. When the background of the table is colored light pink, this indicates a forecast probability which is expected to exceed flood stage.
|
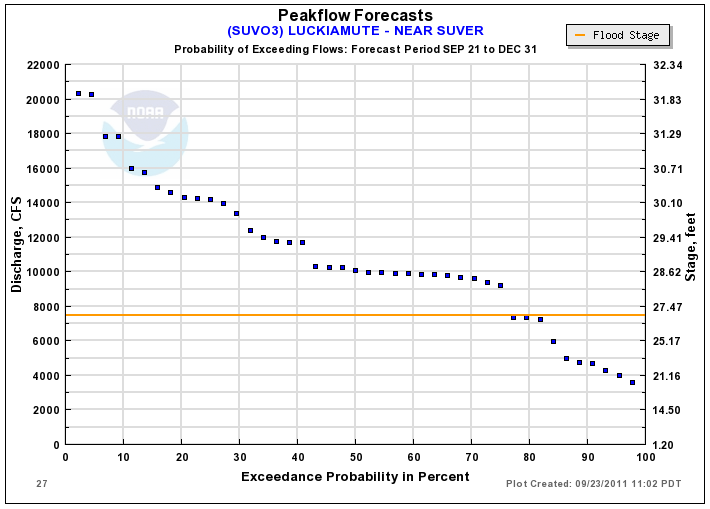
Plot 1:
Peakflow Probability of Exceedence Plot. This plot indicates the probability of flows to reach a certain stage. When the flood stage bar is present the probability of reaching flood stage can be calculated from this plot. To calculate the probability, go to the location where the boxed line crosses the red flood stage line. From this point go straight down to the bottom axis and read of the probability.
|
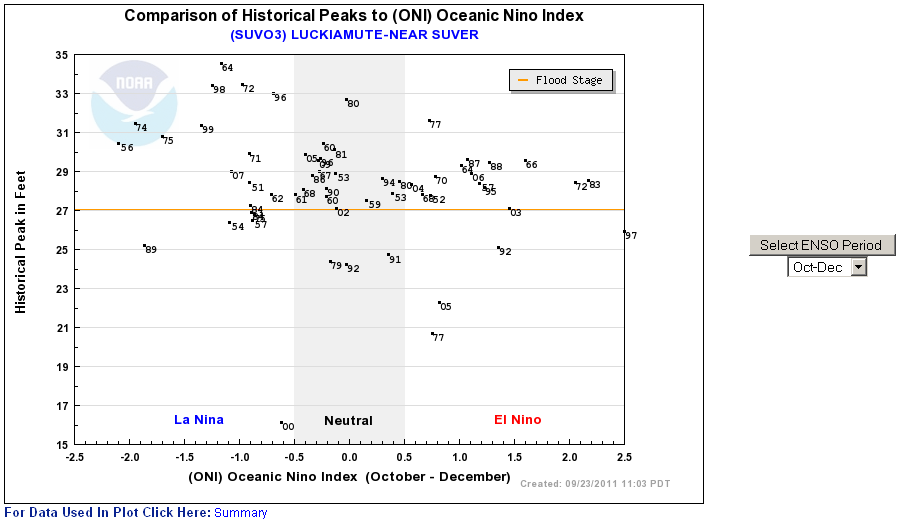
Plot 2:
Peakflow Comparison to ENSO index. The term of El Nino and La Nina are common in climate prediction products. The index is used to summarize the effect mid-latitude sea surface temperatures have on large scale weather patterns. This plot relates that index to occurrence of annual peakflows. The index is base on normalized parameters over a three month period. To the right of the plot, users can decide which three month period they wish to represent as the effecting ENSO period.
|
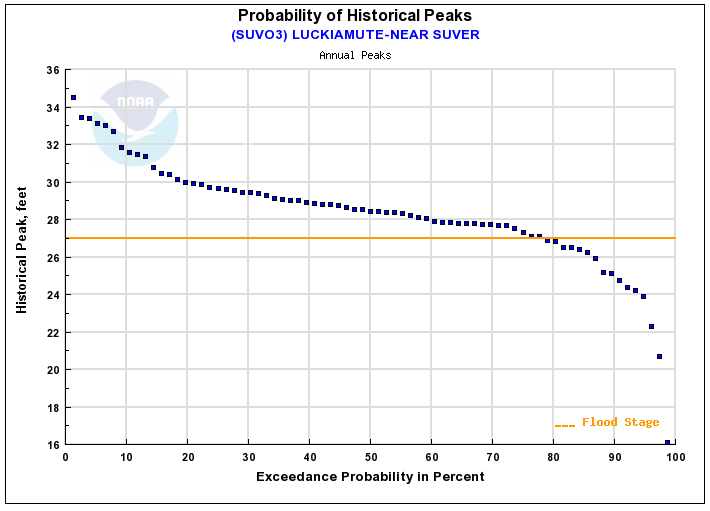
Plot 3:
Annual Peakflow Probability of Exceedence. This product sorts all annual peaks and then applies an empirical probability distribution. An example use of this plot: for planning purposes you may wish to know how often a particular river floods. From the plot below you could determine the probability of exceeding flood is 80 percent in any one year. State another way you could say it floods about once in every ten years. Since these are annual peaks, there is a likelihood that in the years it does flood it could happen more than once.
|
Plot 4:
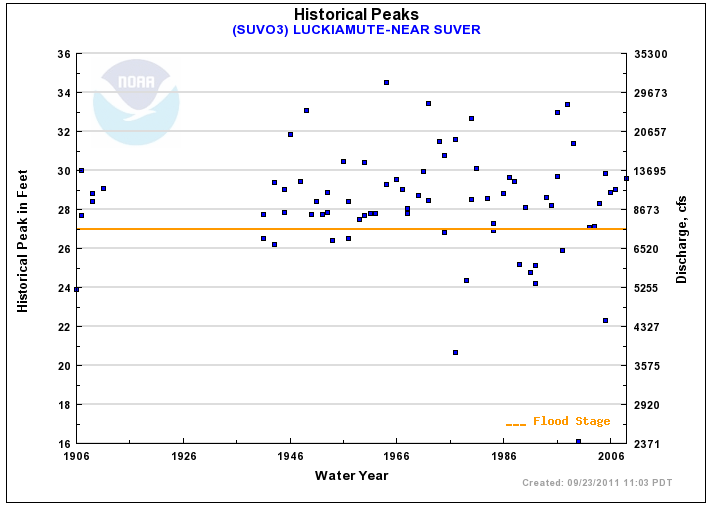
Annual Peakflow Peaks. This is a plot of all the annual peaks plotted in chronological order.
|


